Frictionless time tracking software for teams
Give your team a time tracker they’ll love, and help your managers make profitable project decisions with meaningful time data insights.


Flexible time tracking tool for your business needs
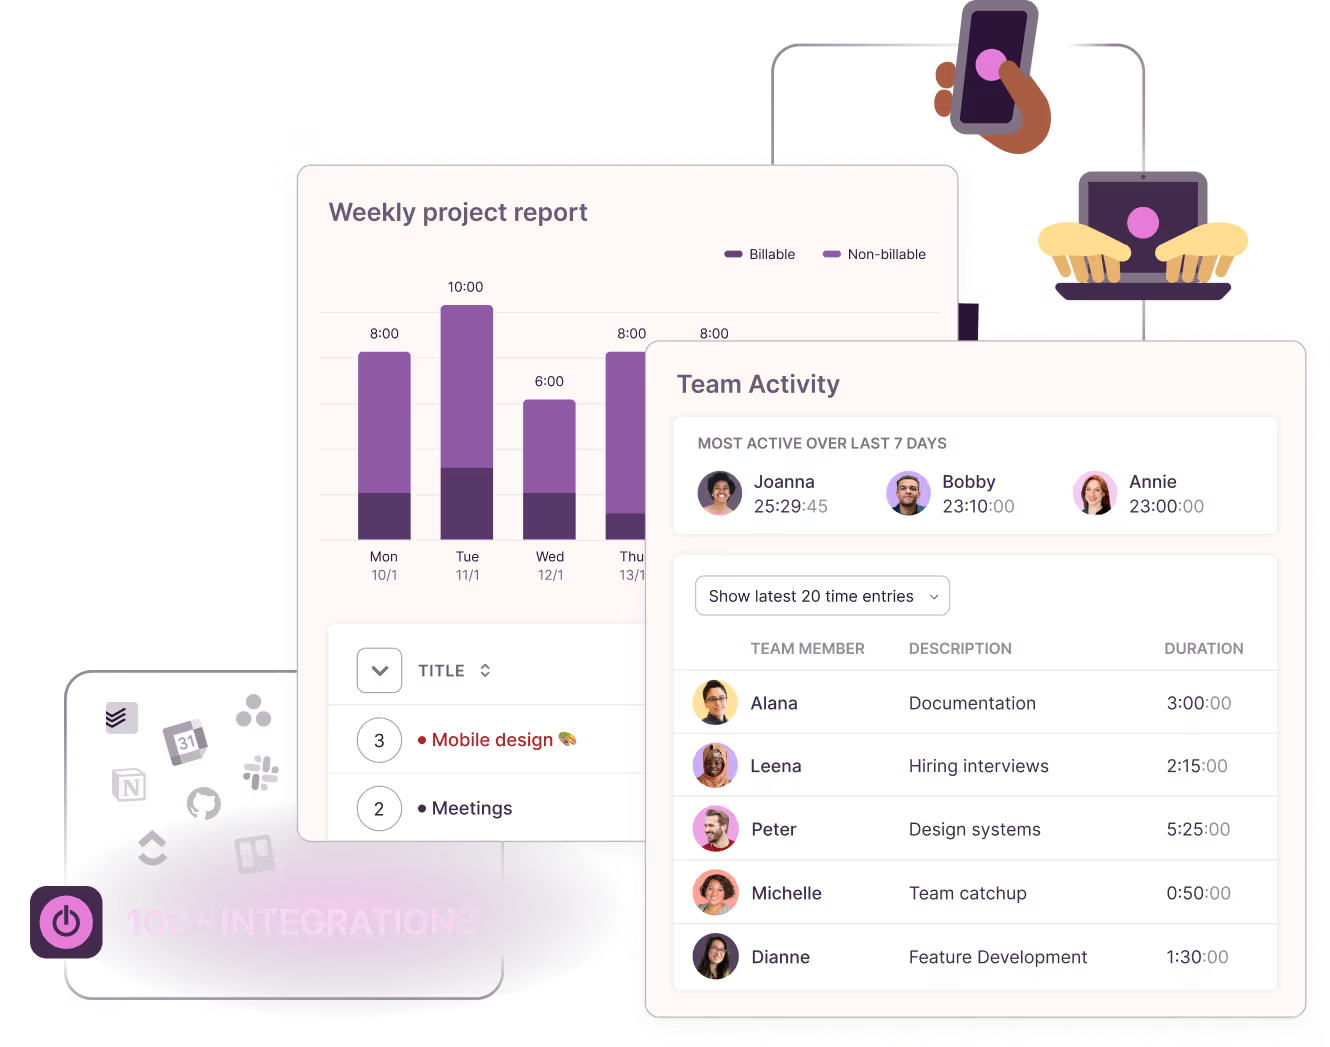
Insightful time reporting software
Know exactly how much time your team spends on tasks
Say goodbye to inaccurate weekly timesheets and get a handle on your team's exact billable and non-billable hours.
More about time reporting

“Time management software that helps improve metrics and estimates”
Marie, Project Coordinator
micromanaging my employees?
No, we do not. At Toggl, we see time as an opportunity.
An opportunity to convert time tracked into actionable insights that boost productivity, increase efficiency and balance team workloads. So you can drive profitability and growth while prioritising your team's trust and well-being.
Companies that use Toggl Track see:
40+ hours saved monthly
at Perception Engineering with one-click time tracking and reporting


100% time tracking adoption
with easy, non-intrusive time reporting at software consultancy Newlogic

20% increase in profitability
by accurately tracking billable work hours at Sweat+Co PR agency

Want better insights on how your team is spending their time?
![]() No credit card required
No credit card required
![]() Free 30-day trial for all features
Free 30-day trial for all features
![]() Cancel anytime
Cancel anytime
The non-intrusive time tracker for self-driven teams


Onboarding a large team? We’d love to show you around.
Teams of 15+ are eligible for a custom demo to see how Toggl Track works at scale.

Time tracking apps for all devices and platforms
GDPR-compliant. Your data is safe with us.
Top-rated customer support with 3-hour response time
99% uptime for your peace of mind
Why 120,000+ users started tracking time with Toggl Track in the last 30 days


Easy for both team members and managers
So nobody views time tracking or reporting as a dreaded chore.
“Versatile and easy even if you’ve never used time tracking software before”
Kathleen, Service Area Manager
Better than the best
And we're 100% against employee surveillance — use a time tracker that gets a "yes" from every employee.
“Chose Toggl Track after trialing 20+ similar time tracking tools”
Andy, Software Consultant
Top-rated support
With a dedicated customer success manager for enterprise teams.
“Regular updates ensure that any bugs are caught quickly and customer support responds within a day; these features make using Toggl Track a breeze.”
Trevor, Senior Project Leader
Get your team going, faster
Low learning curve with no training necessary.
“No complicated setup or unnecessary bells & whistles!”
Renee, Senior HR Coordinator
Track time anywhere
From web to integrations to mobile, there’s a time tracking app for everyone!
“Easy to use time tracking app for desktop and mobile”
Rachel, Small business


Small team and no budget? We have you covered
“The best free time tracking app”

Learning to use Toggl is a breeze, because it's highly intuitive and simple. It ushers you along quickly so that you get back to work right away and start tracking your time immediately. The free plan is generous and could be more than adequate for solo workers or even small groups of up to five people with light needs.

It's not one of those apps where you need to spend half a day figuring out how to actually use it: sessions can be started as they happen or added later, and once the app has got a feel for your schedule and how you work, it'll even make suggestions about what you want to track next.
With Toggl Track, you can track your time right away and view your tracked time entries, and worry about the details later. It also has a generous free tier of service that gives you access to all its apps (Android, iOS, Windows, macOS, Linux, Web, and browser extensions).
Discover how time tracking can help you build a better business with higher profits and happy teams
Toggl Track's Free plan is free forever. Our Premium plan comes with a free, 30-day trial. No credit card required to get started.