Imagine if your time-tracking data wasn’t just another spreadsheet to manage but a tool that delivers actionable insights with just a few clicks. That’s the promise of Analytics in Toggl Track: no exports, no workarounds — just powerful insights tailored to your business needs.
We plan to release many exciting updates related to better time tracking data reporting in the coming months (stay tuned!), and below is what we’re starting with.
All features are being rolled out for Beta users. Share your opinion in the survey here—it will help us create the best time tracking analytics experience for you!
- Not a Beta user yet? Simply go to your Profile Settings, scroll down, select “Enable beta features,” and enjoy early access to updates!
- Don’t see some of the features mentioned? Don’t worry — we’re rolling them out in batches, and you’ll have access any day now!
“I love the new dashboards! They are automatically providing the insights I’ve been requesting, which previously I had to get from Excel.”
– Janet Tuttle, Director Accounting Services, Cover Desk
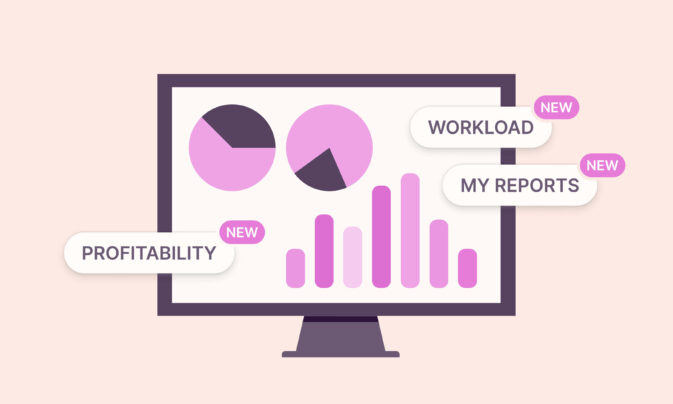
Profit and Cost Analysis: Identify Areas For Optimization
Do you need a more flexible way to track your project and client profitability? Beta users can now create charts that include cost, profit, and fixed-fee profit calculations. This allows you to identify when your company is operating at a loss or profit—and pinpoint areas for optimization.
Our Senior Product Manager, Enzo, explains how.
Flexible Filters: Farewell to Time-Consuming Exports
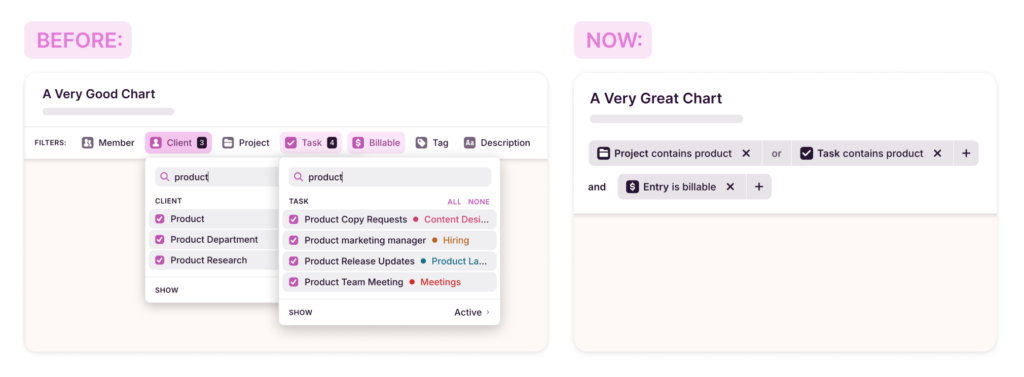
The old vs new filters in Toggl Track Analytics
The previous filters only gave you part of the picture. Whenever you had to export to clean data, there was a hidden cost — time spent, clarity lost, details missed.
Flexible Filters eliminate that cost.
Now, choose from 14 filters, apply custom conditions like “is not,” “is empty,” or “contains,” and set up precise “and/or” logic to shape data your way.
Use it to:
- Tailor filters to your needs: Mix and match filters with “and” and “or” options for precise insights.
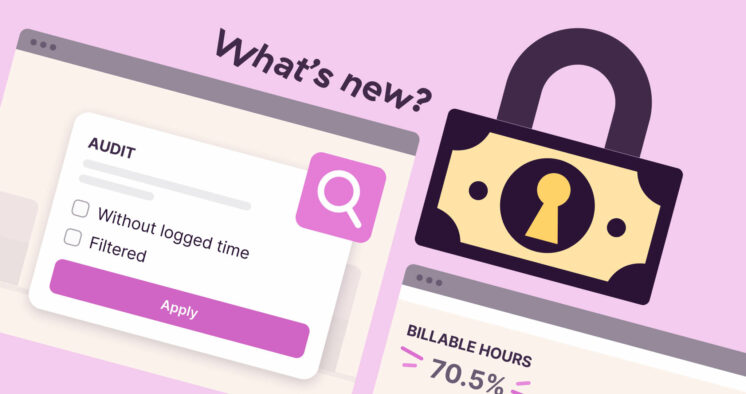
- Quickly audit time entries: Use “is empty” filter to spot gaps and ensure entries are tagged and billed correctly.
- Analyze specific project types: Have multiple projects with similar names, like “[CS]Project A” and “[CS]Project B”? Use filters like “Starts with” to analyze them as a group.
- Exclude non-billable activities for reviews: Use “Does not contain” or “is not” filters to exclude tags like “Internal Meetings” for a clearer view of productive time.
Improved Date Picker: All-Time Data at Your Fingertips
The updated date picker lets you view all-time data and select any time range you need, opening up flexible ways to analyze your data.

Grouped Rounding for More Accuracy
Rounding once only applied to individual entries, which could sometimes cause discrepancies, depending on your use case. Now, apply rounding at any level—ensuring accuracy across your data. Select the rounding interval you need, whether it’s 10 minutes or an hour.
Our Senior Product Manager Enzo explains how.
Important Notes
As this is a Beta release, keep these in mind:
- Minor bugs may occur (we’re here to help!).
- You can revert changes anytime if needed.
- Let us know what you think! Complete this survey to help us improve Analytics for you.

Work tools to elevate your productivity – apps for incredibly simple time tracking and effective project planning.