We are unifying the reporting experience within Toggl Track! Our goal is to provide deeper profitability and productivity analysis, greater flexibility in how you analyze data, and easy ways to customize reports you need.
Key Changes Coming Soon
- Reports, Analytics, and Insights will now be organized into dedicated tabs: Summary, Detailed, Workload, Profitability, and My Reports.
- “Weekly” reports will be renamed “Workload” reports. You will be able to analyze your workload data with custom date ranges, going beyond weekly timesheets.
- “Insights” will be part of the “Profitability” tab, offering a more powerful and multi-level profitability analysis. Break down profitability by member, project, client, and more properties.
- “Analytics” will move under “My Reports” tab, where you can access past custom reports, create new ones, and manage all saved reports in one place.
- Updated Filters will enable you to analyze data right in Toggl Track, without time-consuming exports. Use 11+ properties, 8 condition options, and AND/OR logic for deeper insights.
- You will get more flexibility with expanded properties to group and stack your data.
- Custom reports are now part of paid plans. Free users will still see the titles of any previously created reports (via Analytics), but they won’t be accessible or editable. The ability to save filtered report links is also now part of paid plans. These changes help us keep the core experience free and sustainable, while investing in more powerful, customizable reporting tools for those who need deeper insights. Upgrade here to unlock reports customizability and create reports your way.
Explore key improvements in the video below.
Answers to your FAQ
Find answers to FAQs here to help you prepare for a smooth transition, including:
- Will I still have access to the same data?
- What happens to my existing reports?
- What should I do if I run into issues?
Let’s now explore what you will be able to do in each Reports tab.
Summary Report
👉 Get a quick high-level overview
Instantly access key productivity and profitability metrics, including total tracked hours, billable vs. non-billable work, total billable hour value, and performance trends.
Example of the Summary Report
Detailed Report
👉 Get a comprehensive view of all Time Entries
The Detailed Report provides a full view of time entries. Using Filters, you can conduct a comprehensive time entry audit, verify billable hours, and prepare accurate invoices.
Here’s how to make the most of it:
- Identify missing data in time entries by using the “is empty” condition in Filters.
- Exclude non-billable activities by applying “Does not contain” or “is not” filters — perfect for omitting meetings or internal admin time.
- Review related time entries together with the “Starts with” condition.
- Detect anomalies by filtering out time entries shorter than 1 minute or longer than 8 hours using the Duration filter.
Workload Report
👉 Timesheet view to evaluate your resources
Workload reports help you understand how time is distributed across your team, projects, and clients.
- Visualize workload by time or revenue: Assess team workload based on tracked time or revenue generated.
- Break down workload by Member or User group, Project, Client, Task or Tags. See where resources are allocated and optimize distribution.
- Revenue-based workload analysis: Identify high-revenue contributors and balance workload for improved profitability.
Profitability Report
👉 Get multi-level profitability analysis
We’ve made significant improvements to how you can analyze profitability. Analyze profitability, revenue, and labor costs — breaking it down by Members, User Groups, Projects, Clients, Tasks, or Tags for a more detailed view.
This way, you are now more equipped to improve pricing, staffing, and project budgeting decisions.
My Reports
👉 Build custom reports to fit your stakeholders’ specific needs
Here you’ll find all your saved and custom reports, including those previously created with Analytics.
- Customize reports to display only the most relevant data.
- Visualize your data with a range of options to present insights clearly.
- Share reports from Toggl Track directly with your team and stakeholders.
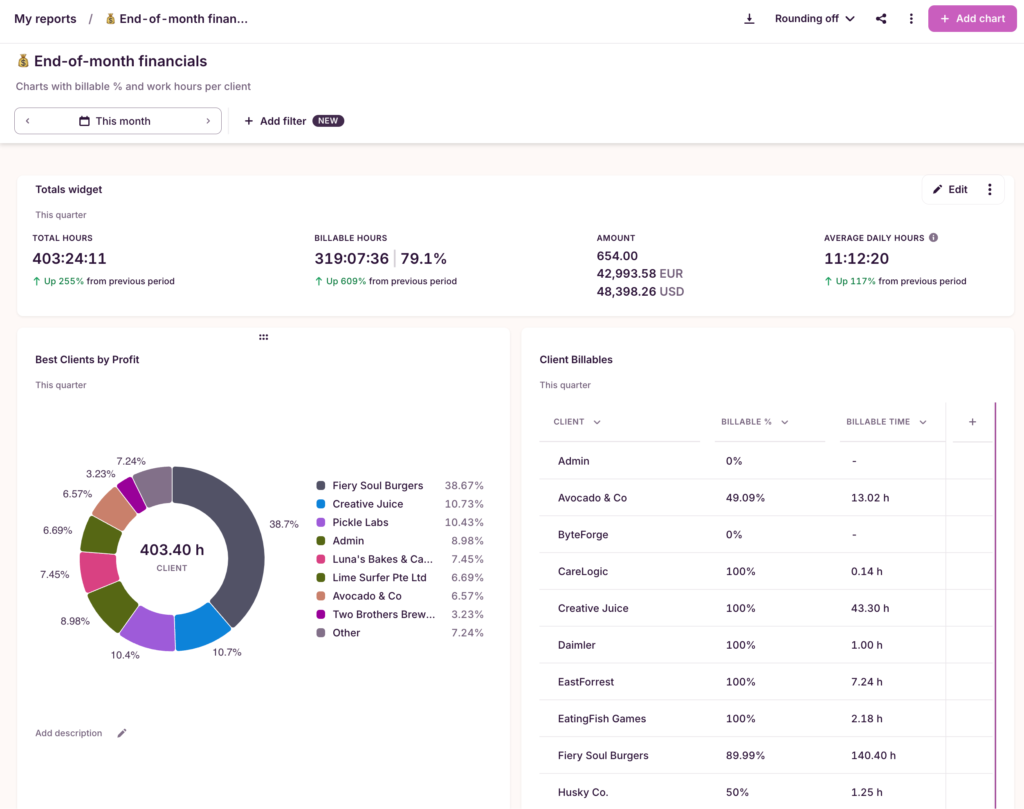
A custom report: End-of-month financials, featuring client data
Reports Pricing
With the new experience rolling out, here’s how reporting features show across different plans.
Note for Free users: Custom report creation will no longer be available on the Free plan. You’ll still see the titles of your previous custom reports, but they won’t be accessible or editable. Upgrade here to unlock full control and create reports your way.
Here is a detailed Reports pricing breakdown.
Ideal for
High-level personal analysis
Team-level and revenue analysis, enhanced customization
Full profitability analysis and full customization
Reports access
Summary, Detailed, Workload
Summary, Detailed, Workload, My Reports
Summary, Detailed, Workload, My Reports, Profitability
Profitability
Profitability analysis
❌ No
❌ No
✅ Yes
Analysis metrics
Time
Time, Revenue, Billable time, Non-Billable time, Billable %
Time, Revenue, Billable time, Non-Billable time, Billable %, Cost, Profit, Profitability
Customizations
Custom reports
❌ No
✅ Unlimited
✅ Unlimited
Chart types in “My Reports”
None
Bar, Stacked Bar (Stack only by billable), Donut, Table, Pivot Table, Line
Bar, Stacked bar (Stack by all properties), Grouped Bar, Donut, Table, Pivot Table, Line, Multi-Line
Add columns to tables
✅ Yes
✅ Yes
✅ Yes
Filter properties
Client, Project, Tag, Description, Start/End Date
All Free options + Member, User group, Task, Currency, Billable, Billable Rate
All Starter options + Fixed Fee, Duration Audit, Revenue Audit, Cost
Conditioning options
is, is empty, is on
is, is not, is empty, is on, is not on
Full options (e.g., contains, greater than, less than, starts with, ends with)
AND/OR logic
❌ No
❌ No
✅ Yes
Rounding
❌ No
✅ Yes
✅ Yes
Data grouping levels
Up to 2
Up to 3
Up to 3
Grouping properties
Member, Client, Project, Description
All Free options + Task, Tag, User group, Billable
All Free options + Task, Tag, User group, Billable
Custom company logo
❌ No
✅ Yes
✅ Yes
Group similar time entries
✅ Yes
✅ Yes
✅ Yes
Combine groups with the same name
❌ No
❌ No
✅ Yes
Sharing and exporting
Sharing within Organization
❌ No
✅ Yes
✅ Yes
Sharing externally
❌ No
✅ Yes
✅ Yes
Scheduling to email
❌ No
❌ No
✅ Yes
Exporting
PDF, XLS, CSV
PDF, XLS, CSV
Creating invoice
✅ Yes
✅ Yes
✅ Yes
Let’s make the transition smooth for you
Have questions or feedback? Join the Toggl Community — our team is ready to help you every step of the way.
Your feedback shapes a better, more powerful time tracking experience for everyone.

Work tools to elevate your productivity – apps for incredibly simple time tracking and effective project planning.