Google Sheets is a powerful Excel alternative. However, it does not come with Gantt charts, so in this guide, we’ll explore how to create them using the built-in stacked bar chart in Google Sheets.
Specifically, you’ll learn:
- What is a Gantt chart?
- What are its main elements?
- Pros & cons of Google Sheets Gantt charts
- How to create a Gantt chart in Google Sheets?
- And, using free Google Sheets Gantt chart templates
In addition, you’ll also learn about a simpler way to create Gantt charts that can be easily updated as and when plans change.
Let’s get started.
What is a Gantt Chart?
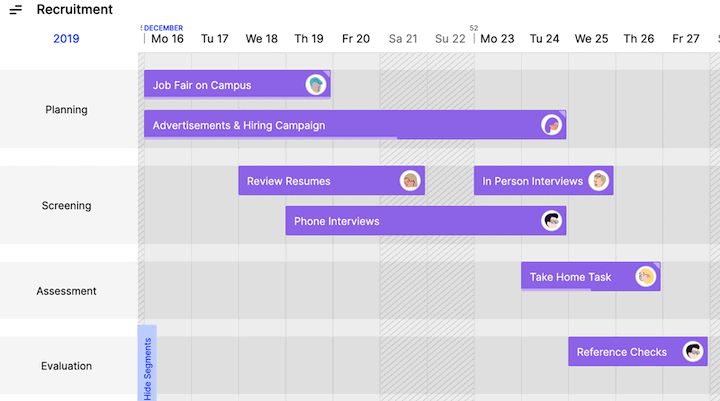
A Gantt chart is a series of horizontal lines along a horizontal timeline that visually shows the planned and/or done work.
Because of its visual nature, a Gantt chart gives clear cues about what works needs to be done, and by when. Thus, helping bring more clarity to work.
Elements of a Gantt Chart
A Gantt chart has 5 major elements. These are:
- Timeline: The horizontal axis of the Gantt chart represents a project’s timeline. Depending on the project, the timeline can be granular up to a day, week, or month.
- Tasks: The vertical axis of the chart represents the project activities. Optionally, tasks can also be grouped into segments.
- Bars: Horizontal bars on the chart represent when a task will be completed. These bars begin at the start date of a task. And, run parallel to the timeline for the duration of the task.
- Milestones: Tasks are grouped into phases. A milestone marks the end of a phase. And, a milestone is said to be achieved when all the tasks in the phase are done.
- Resources: People, tools, and other resources are assigned to a task. That way allocation of resources can be managed better across tasks.
Pros & cons of Google Sheets Gantt Charts
A Google Sheets Gantt chart is not very flexible. However, it comes with its own advantages.
- Easy to get started: With the familiar Microsoft Excel-like interface, Google Sheets is easy to get started for most managers.
- Shareable: Unlike Excel, Google Sheets is shareable. This way, more than one person can work together on the same sheet.
- Free: Google Sheets comes for free along with the Google Drive suite of office tools.
On the other hand, Gantt charts created in Google sheets have the following disadvantages:
- Not suitable for complex projects: With Google Sheets, it’s easy to visualize simple timelines. But, things can quickly become complex for projects with more than a few tasks.
- Hard to keep up-to-date: Google Sheets are shareable, online spreadsheets. However, it can still become frustrating for multiple team members to collaboratively keep it updated.
- No milestones: You cannot add milestones to Gantt Charts created using Excel or Google Sheets. And, as we’ve seen, milestones are important elements of a Gantt Chart.
- One dimensional: Google Sheets or Excel Gant Charts are always from a task planning point of view. However, these charts fall flat when it comes to managing resource allocation along with task management.
How to make a Gantt Chart in Google Sheets?
Because of these drawbacks, Google sheets is not an ideal tool to create a project timeline.
However, it may still make sense to use Google Sheets. Particularly, if you’re looking for a quick-fix solution to present a project’s timeline schedule.
Alternatively, you can also use MS Excel. Learn how to create a Gantt chart in Excel.
Let’s look at the steps needed to create a Gantt chart in Google sheets.
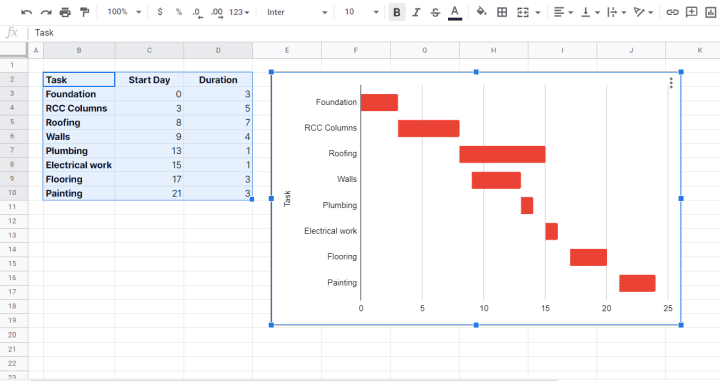
Step #1. Prepare the chart data
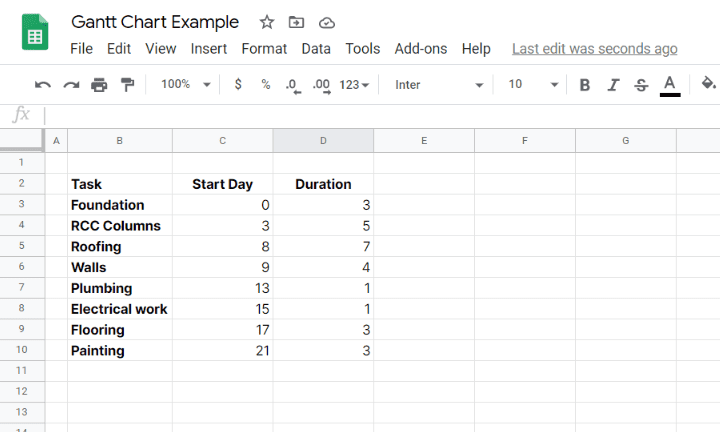
First, you need to prepare the data needed for the Gantt chart. You’ll need three columns:
- Tasks: Project activities that appear on the Gantt chart.
- Start Day: The day on which a task starts on the project timeline.
- Duration: The duration in days to complete the task.
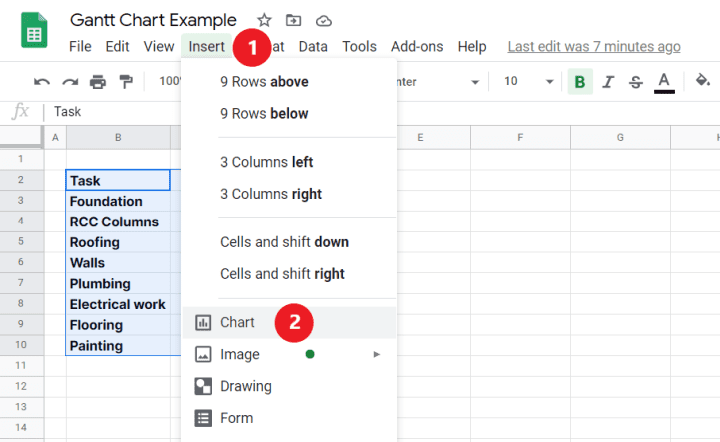
Step #2. Insert a stacked bar chart
Second, we need to convert this data into a chart.
As we saw earlier, Google Sheets does not come with a built-in Gantt chart. Instead, we’ll use a stacked bar chart. And, then we’ll customize it to look like a Gantt chart.
To insert the stacked bar chart:
- Select the prepared data.
- Then, click on Insert > Chart.
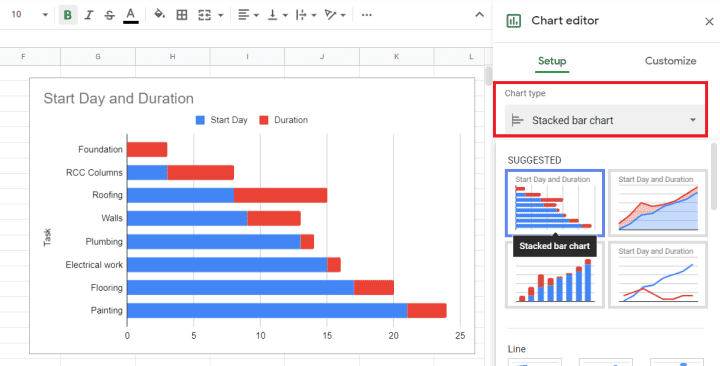
This should automatically insert a stacked bar chart. However, if it doesn’t, you can manually change the chart type. Here’s how:
- Click on the chart to select it.
- Click on the three dots in the top-right corner, then click Edit chart.
- Select Stacked bar chart in Chart editor > Setup > Chart Type
Step #3. Customize the chart
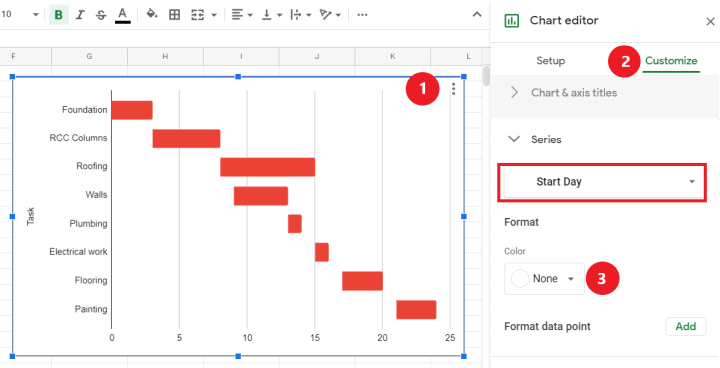
Finally, we need to format the stacked bar chart to look like a Gantt chart.
To do that, we’ll change the color of the Start Day from the default Blue to None. Here’s how:
- Click on the chart to select it.
- Click on the three dots in the top-right corner, then click Edit chart.
- Go to Chart editor > Customize > Series and select the Start Day series.
- Set the Format > Color to None.
And that’s it. Your Gantt chart is ready.
Gantt Chart Template for Google Sheets
So far we’ve created a simple Gantt Chart using Gooogle Sheets. However, you cannot do much with it. If you’re looking for a comprehensive project Gantt Chart template, you may want to look at this template.
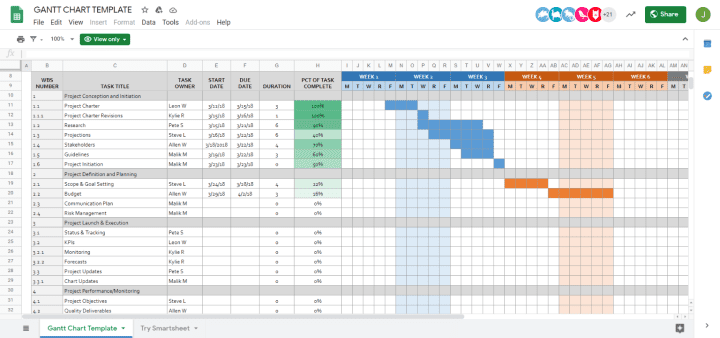
However, like any Google Sheets Gantt chart this detailed template has two major drawbacks:
- It’s hard to keep up-to-date. Delete a formula by mistake, and all your data goes for a toss.
- It’s great for looking at what task happens when. But, falls short when it comes to resource allocation.
Simple & free alternative to Google Sheets Gantt Charts
You can make a Gantt Chart in Goggle Sheets or Excel quickly. However, these Gantt Charts are at best useful for presentations.
Plus, managing a project from a spreadsheet is not such a great idea. It’s hard to work collaboratively, and yet keep the project information up-to-date.
That’s where Toggl Focus can help:
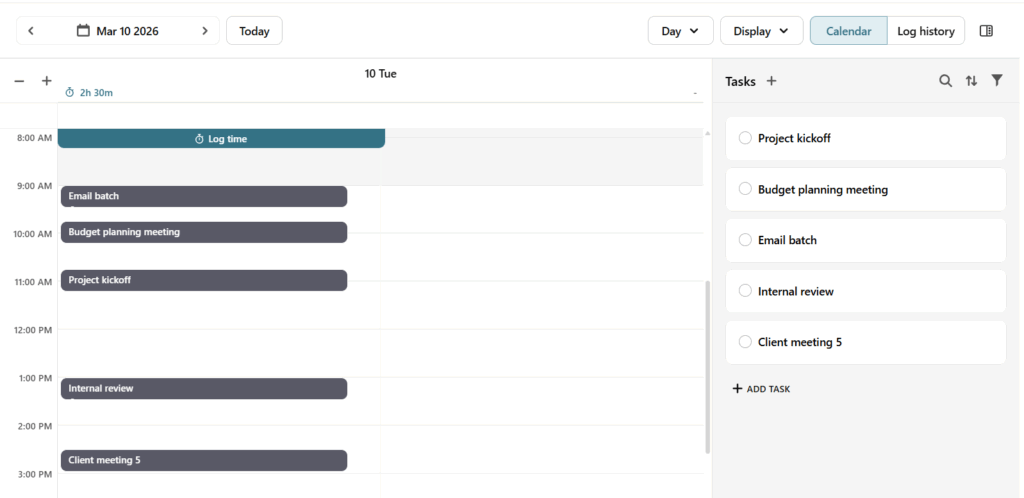
With Toggl Focus you can:
- Create a Gantt Chart to plan a project’s schedule.
- Create a team workload timeline to manage resource allocation.
- Easy to use, drag & drop interface to quickly add and update the Gantt chart timelines.
- Add milestones to deliver project phases on time.
- Assign tasks to multiple team members. Track progress as tasks move from to-do to done.
- Team members can collaborate on tasks using attachments and comments.
Best of all, Toggl Focus is completely free for individual users.

Elizabeth is an experienced entrepreneur, writer, and content marketer. She has nine years of experience helping grow businesses, including two of her own, and shares Toggl's mission of challenging traditional beliefs about what building a successful business looks like.