Time tracking is only as good as the insights it gives you.
Whether you’re tracking profitability, productivity, revenue, or team workload, reporting in Toggl Track delivers instant, actionable insights — without the complexity. You can easily zoom in on the details or step back for high-level overviews. With highly customizable filters and flexible report views, you get deep analysis of your time and revenue data — all while keeping everything intuitive and easy to navigate.
Let’s see what you can do in each of the Reports tabs.
Summary Report
👉 Get a quick high-level overview
Instantly access key productivity and profitability metrics, including total tracked hours, billable vs. non-billable work, total billable hour value, and performance trends.
Example of the Summary Report
Detailed Report
👉 Get a comprehensive view of all Time Entries
The Detailed Report provides a full view of time entries. Using Filters, you can conduct a comprehensive time entry audit, verify billable hours, and prepare accurate invoices.
Here’s how to make the most of it:
- Identify missing data in time entries by using the “is empty” condition in Filters.
- Exclude non-billable activities by applying “Does not contain” or “is not” filters — perfect for omitting meetings or internal admin time.
- Review related time entries together with the “Starts with” condition.
- Detect anomalies by filtering out time entries shorter than 1 minute or longer than 8 hours using the Duration filter.
Workload Report
👉 Timesheet view to evaluate your resources
Workload reports help you understand how time is distributed across your team, projects, and clients.
- Visualize workload by time or revenue: Assess team workload based on tracked time or revenue generated.
- Break down workload by Member or User group, Project, Client, Task or Tags. See where resources are allocated and optimize distribution.
- Revenue-based workload analysis: Identify high-revenue contributors and balance workload for improved profitability.
Profitability Report
👉 Get multi-level profitability analysis
We’ve made significant improvements to how you can analyze profitability. Analyze profitability, revenue, and labor costs — breaking it down by Members, User Groups, Projects, Clients, Tasks, or Tags for a more detailed view.
This way, you are now more equipped to improve pricing, staffing, and project budgeting decisions.
My Reports
👉 Build custom reports to fit your stakeholders’ specific needs
Here you’ll find all your saved and custom reports.
- Customize reports to display only the most relevant data.
- Visualize your data with a range of options to present insights clearly.
- Share reports from Toggl Track directly with your team and stakeholders.
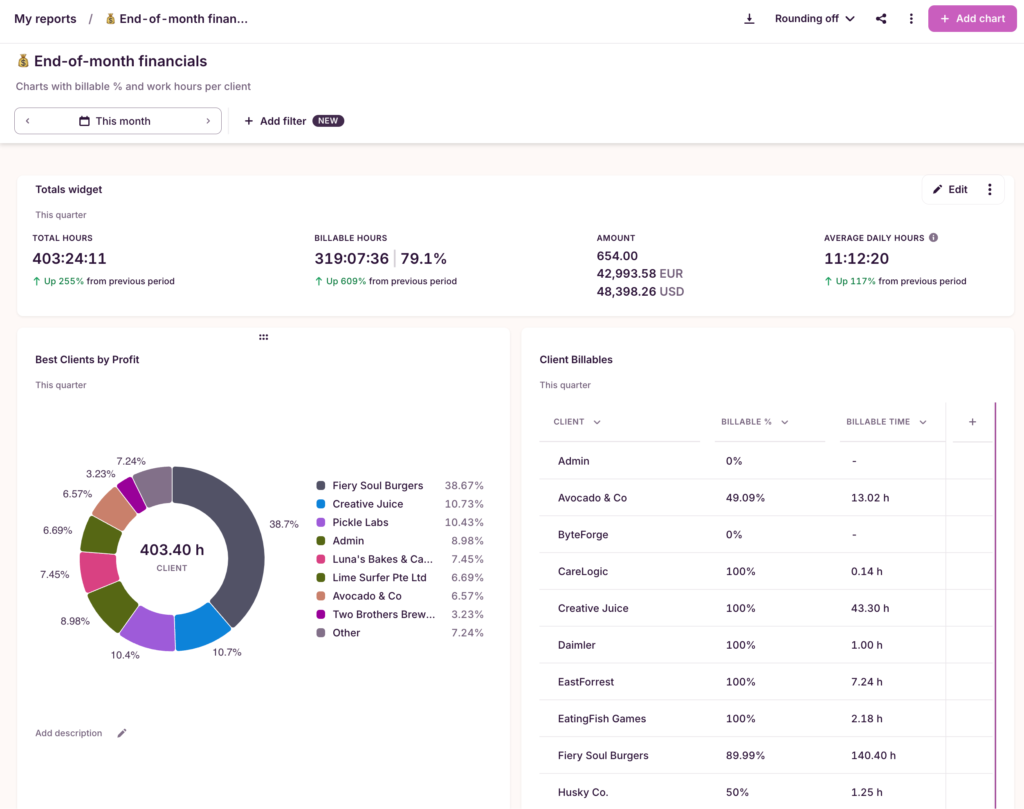
A custom report: End-of-month financials, featuring client data

Work tools to elevate your productivity – apps for incredibly simple time tracking and effective project planning.