Every year, the manufacturing company where I used to work had a holiday party. In addition to drinks, dancing, and dinner, it featured an awards ceremony where employees received prizes for “Best Smile,” “Microsoft Master,” stuff like that. I can’t remember now what awards I got, but none of them were ever for “Best Team Leader.”
After a certain work-related debacle, there was no way my name would ever come up on that nomination list. What makes this memory extra-painful is that I thought I was doing the right thing.
I was managing a project that transitioned the company product manuals from a legacy management system to a new one that supported easy cross-document updates and maintenance.
Every person on the team had been with the company for years and had worked on similar projects in the past. I was new to leading a team and didn’t want to come across as a micromanager, so during the inaugural meeting, I made the project objectives clear (so I thought) and left it at that. We had weekly meetings, during which everyone assured me that things were fine.
My Big Managerial Mistake
Here’s the catch. I assumed that we were all on the same page after the first meeting. In retrospect, I don’t think we were even in the same book. Everyone understood the goal, but they didn’t know how to get there. They used outdated tools that they were more comfortable with instead of newer versions that supported the new platform, and by the time I discovered the mistake, we were halfway to our deadline.
No, ladies and gentlemen, the ends do not always justify the means, especially if the means are version 8 and the industry standard is version 10.
I was dismayed and embarrassed. So was my supervisor. If we weren’t so deep into the project by the time this fundamental mistake was discovered, he would have replaced me with another manager. As it was, I had to explain to the department heads that I was going to need the employees they had loaned me for another three weeks. You can imagine how well that went over.
When people make a career blunder, they usually do one of two things. They drop that path like a hot potato and look for opportunities more suited to their “skillset.” Or they look for a solution.
I took the latter path. Let me tell you about the solution I found.
What Is a Gantt Chart?
If you’ve managed projects in the past, you’ve probably heard of Gantt charts. Simply defined, they are horizontal bar charts that provide a visual representation of a project. Gantt charts enable you to see and evaluate the following project essentials at a glance:
- Task start and end dates
- The team members assigned to each task
- Any dependencies between tasks (a relationship between them that requires one to be completed before the other can be started)
- Project milestones, which are tasks that mark important achievements in the project.
Gantt charts were conceived by management consultant and mechanical engineer Henry L. Gantt (1861-1919), who thought project managers in factories and workshops needed a visual tool to help them measure progress.
When these charts first appeared, they were a radical concept. At the time, they looked more like tables than the color-coded charts used today, but they made it easier to plan production schedules. Gantt chart historian Wallace Clark wrote in 1922:
“The Gantt progress chart enables the manager to keep before him all the promises he has made, to concentrate his attention on overcoming obstacles and avoiding delays, and, when it is impossible to live up to a promise, it enables him to give the customer advance notice of the fact.”
By the 1920s, they were an indispensable project management tool. Gantt charts were used to build the Hoover Dam,, starting in 1931. They were also used to design and build the interstate highway system in 1956.
By the 1950s, Gantt charts had progressed from a series of tables to a bar chart that had to be revised manually every time something changed. When computers became mainstream, project managers used software tools like Excel and PowerPoint to plot charts that looked great but took time to update for bigger projects. There was also no logic holding them together, aside from what you could create using an Excel formula.
In other words, better than before, but still room for improvement.
The Modern Gantt Chart
Today, there are web-based tools that make it easy to plan, generate, and maintain Gantt charts that deliver an effective and accurate overview during all stages of your project. Although created by computer, they remain true to Gantt’s original innovative vision. The Association for Project Management noted that if Gantt were alive today, he would recognize these computer-generated charts as a descendant of his original concept.
Despite their impressive pedigree in project management, I wasn’t too sure about using Gantt charts to make me a better project manager. Some of my concerns were:
- Too many moving parts that would make them really time-consuming to produce.
- I had been managing projects for nearly two years and never heard of Gantt charts. Would embracing them now make me look like an imposter or worse, someone who’s behind the times?
- I was worried that it would be hard to get my team on board. Their resistance to new tools had already gotten me in trouble and caused my last project to blow both its schedule and budget.
Despite my misgivings, I decided to give them a try. If they helped to build the Hoover dam, there had to be something in them, right? Gantt charts might have been the domain of engineers and mathematicians in the 1930s, but today they were accessible to anyone with a computer, a project, and a professional reputation to salvage.
Someone like me.
The Benefits of Using a Gantt Chart as a Manager
Although Gantt charts were originally designed to guide project managers through complex infrastructure projects, they’re also an ideal tool for people who don’t have a degree or any formal training in project management. Here are the benefits that I realized:
Greater Clarity
Gantt charts simplify and clarify the project timeline by helping you visualize the timeline for a project and get a visual overview of what everyone on your team is working on. Complex information is also more manageable due to the visual nature of the charts. You can see at a glance:
- Which team member is working on any given task
- The scheduled completion date
- How the task connects to the project
Tasks are displayed as horizontal lines across sections of the timeline, Each one can be color-coded to represent the team member working on it, so you can also see who has too many (or not enough) tasks assigned to them and adjust accordingly.
Ability to Plan in More Detail
Although they deliver a bigger-picture overview of your project, Gantt charts also force you to plan in more detail. When you add content to your timeline, such as tasks and milestones, you will remember other, related, steps that belong on the timeline too. The result is an ability to see how all the tasks fit together and whether the projected deadline is reasonable.
Greater Transparency
Gantt charts support greater transparency for you and everyone on your team. As tasks are assigned and progress details are publicly displayed on the chart, everyone can see how the project is progressing. For example:
- Tasks can be shaded on the chart to reflect level of completion
- Team members can click on a task to view start date, stop date, and other details.
The ability to track progress easily can also be a source of team motivation, which translates into greater productivity. Individual members strive to complete the tasks they are responsible for and demonstrate their commitment to a successful outcome.
More Effective Resource Planning
When you use a Gantt chart, you can distribute the workload more effectively across teams because you can see both current and future project schedules on their respective timelines. You will know when your department will be tasked with a project and what employees will be available during that time to join your team.
When you can visualize resource capacity, it’s easier to allocate talent without overworking any individual employees.
Everyone Stays on the Same Page
When all project information is viewable on a Gantt chart, different stakeholders, such as team members, company management, and clients, can share information and remain current as the project progresses or changes.
As project manager, you can use the chart to communicate with multiple parties at the same time. When you use cloud-based Gantt chart software, you can:
- Automatically update schedules and change requirements in real time
- Share this information with anyone who has an Internet-enabled device, which is invaluable if your agency uses remote teams.
In general, I found that when I started using Gantt charts for my projects, everyone on the team understood what their responsibilities were and how their tasks related to the bigger project. These details also helped me schedule project milestones, such as completion of a certain category of manuals, without overwhelming the team. I could also see how much effort would be required from each person, which is important information to have when you’re trying to accurately determine the project’s scope, timeline, and budget.
How to Create a Gantt Chart
As I stated previously, before the advent of the personal computer and the Internet, people would create Gantt charts on paper and a few extra-creative individuals used Legos! Now, they can be made more quickly and easily using software, and adjusting them is a simple matter of firing up your browser and doing some clicking and dragging.
Here’s a hypothetical example to get you started.
Step 1: Identify Your Key Tasks
Your company has tasked you with redesigning the corporate website so that it is mobile-friendly and contains more interactive features, such as social media platforms and chatbot. Your task list might look like this:
- Select a content management system to build the site itself
- Redesign the company logo
- Take new product photos
- Build and customize a chatbot
- Set up a company LinkedIn, Facebook, and Twitter account
- Purchase any necessary upgrades for the company-owned graphic design and web-building software (it’s important- take it from me!)
Step 2: Estimate How Long the Tasks Will Take
If you don’t have direct experience with any of the tasks, speak to those with the requisite background for a reasonable estimate of how long it will take to achieve a particular deliverable, such as 50 product photos or the chatbot. Use their insights to decide on the earliest start date and the estimated duration of each task.
For sequential tasks, define which stage in the project cycle they depend on. For example, all image work needs to wait until you’ve acquired the necessary upgrade licenses for the company’s older graphics software.
Step 3: Assign Each Key Task
Now that your tasks have been identified and placed on the timeline, it’s time to assign them to your new team.
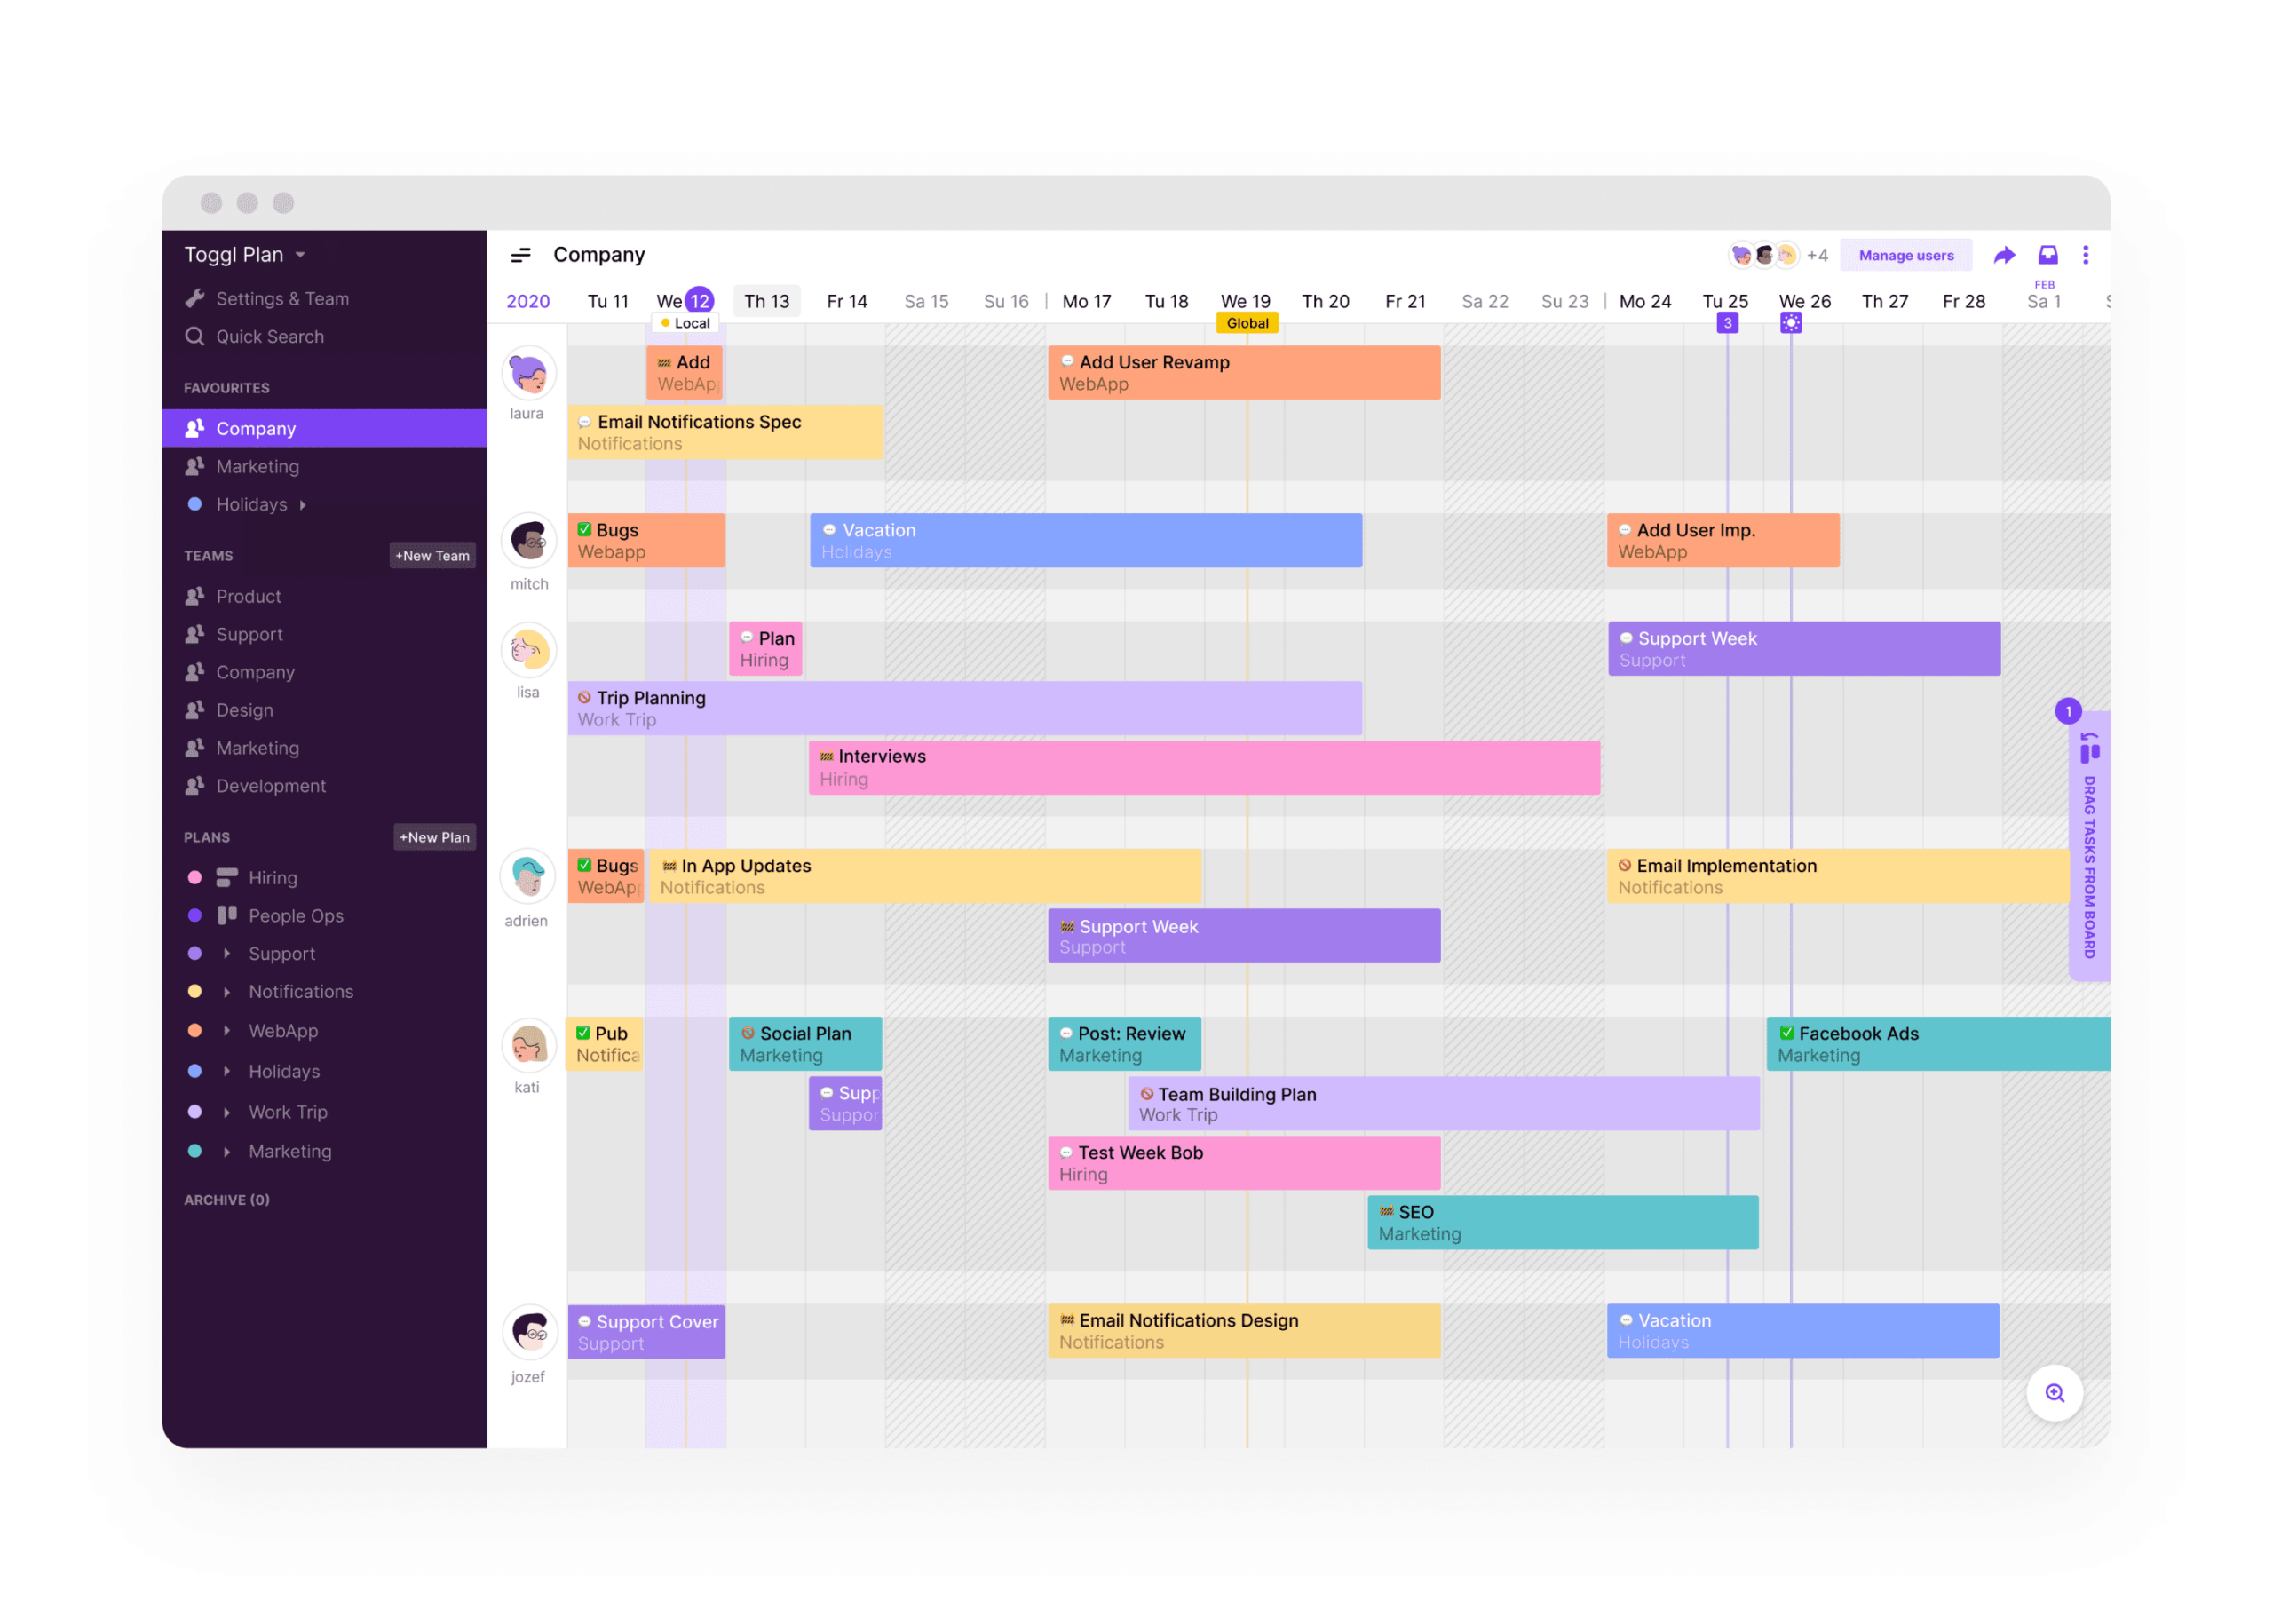
I use Toggl Plan to create my Gantt chart schedules. This free project management software is browser-based, so you can access it from anywhere as long as you have an Internet device and an active connection. It gives me an excellent overview of project workflow: by showing me which team member is doing what at any given time and what milestones lies ahead, I can react more productively to change and support team efficiency.
If you use Toggl Plan, start by adding your team members to the timeline. There are two ways you can add users:
- Click on the plus icon in your timeline’s bottom-left corner and type the person’s name or email OR
- Click on ‘Users’ in the upper right corner. Then click on the plus sign in the bottom-right corner and input their name or email
I enter the user’s email address instead of their name, so that they received an email invitation that shows them how to log in. If the person says that they never received their invitation, tell them to check their Spam or Junk folder. If it’s not there, try re-sending it or copy and paste the invite URL into an email and sending it to them directly.
Once you have everyone added to the timeline, start adding tasks. This is one of my FAVORITE Toggl Plan features: adding a task is as easy as pointing on the timeline and clicking. A pop-up box appears, allowing you to enter all relevant task details, such as an estimate of the hours it will take and any associated sub-tasks.
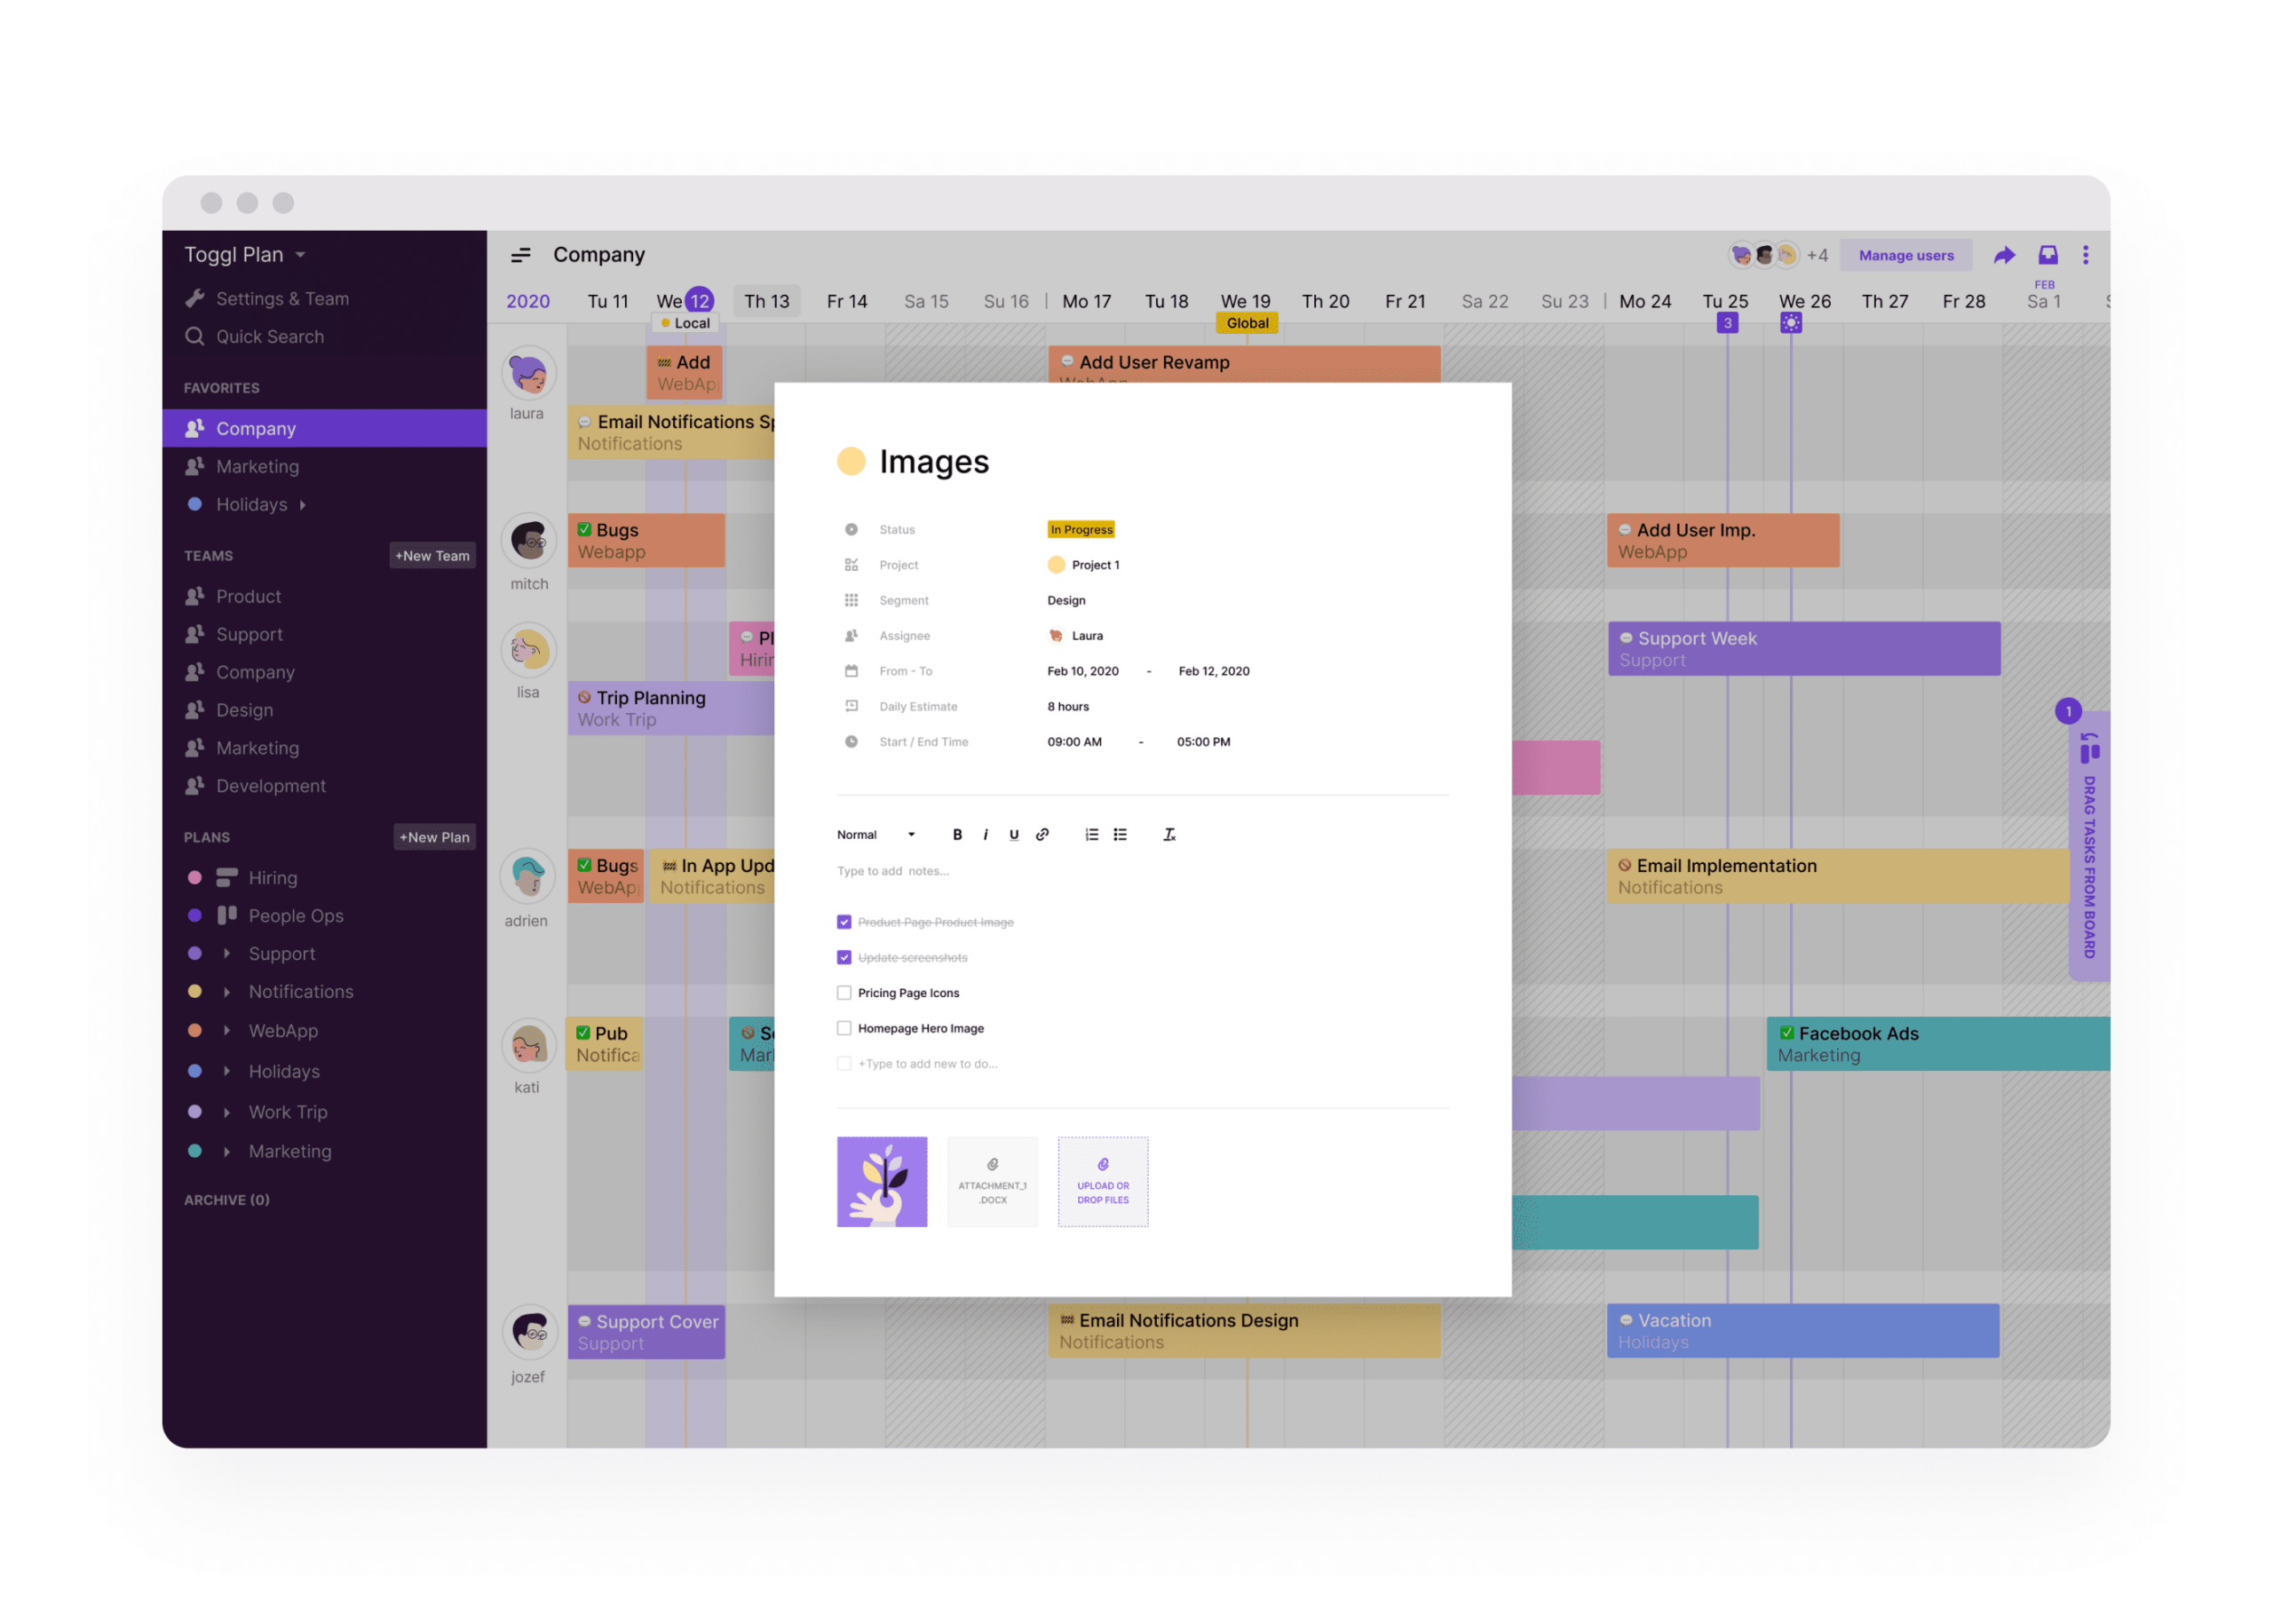
If you need to edit a task or even mark it as complete, click on it and adjust the information in the pop-up box. To change multiple tasks at once, such as marking them all complete, simply press shift while dragging your cursor to select them and update as needed.
When you assign a task to your project, it will be given its own color, making it easy to visualize how work is progressing. Toggl Plan now supports custom colors, so if your creative agency receives a new project from a client, you can adorn their timeline with the client’s branding. It’s a nice touch that they will appreciate.
How to Be a Better Manager With the Help of A Gantt Chart
Once you build your Gantt chart, you’ve got a combination of blueprint and bird’s eye view of the entire creative project from kickoff to completion. You can take in its entire scope at a glance and share that visual guide with others. In terms of your project management ability, using a Gantt chart can make you a better manager.
You Can Create More Accurate Timelines
Gantt charts allow you to track how long it takes your team to finish projects that your agency routinely handles. If you’re a content marketing agency, for example, after you’ve used Gantt charts to plan a few major projects, you can discover that it takes three days to write the proposal for the client, four days to research blog content ideas, and two days to have a draft blog ready for the client’s approval. You can use this knowledge to plan more accurately in the future.
You Know Everyone’s Workload
When you’re planning and scheduling a project, it’s a huge benefit to be able to see the workload of your entire team. Can Zoe take on any more graphic design work now that new photos have been taken or is her plate full at the moment? If it is, John appears to have a comparatively light workload over the next three days, so he can assist with the photos. You get the idea.
You Can Keep Everyone Informed of Project Progress
Gantt charts can be shared, so everyone knows what’s happening with the project at any given time. This can eliminate a lot of problems that can arise from assumptions and misunderstandings and spare anyone the necessity of sitting through some tough conversations down the road.
Project Hurdles Can Be Anticipated
If you’re like me, you’ve had the unpleasant experience of finding out about problems after the fact. It’s not until you’re sitting in the weekly progress meeting and asking for an important report that you learn it’s only halfway done when the deadline was yesterday.
When you’re using a Gantt chart, you don’t have to worry about eleventh-hour bad news. You’ll be able to spot them in a single glance. If an important milestone is coming due and progress is lagging, you can divide up the work or allocate more resources before the entire project can stall.
Conclusion
After the debacle I referenced at the beginning of this article, I did a lot of research on project management tools. When the success of a project is riding on my shoulders, I didn’t want to lie awake at night wondering if everyone on the team was doing their part. I didn’t want to stress about whether or not the project would be completed on time and in accordance with the scope.
Using Gantt charts enabled me to acquire the insights and level of control I needed to prevent a disaster like the product manual transition project. No sooner had I gained an understanding and appreciation of what they can do, then I was assigned to fill in for a project manager who’d fallen ill. It was my second chance, and I ran with it.
This project was for an online distance learning initiative that the company wanted to make available to its remote workers. After I itemized the tasks, selected the team, and imported both into Toggl Plan, I had better insights into what everyone was doing, how close we were to accomplishing deliverables, and even what tools everyone was using to do their jobs. The result was a successful project that was delivered on time and within budget.
I thought my boss would have the same reservations about Gantt charts that I initially did. Quite the opposite. He admitted that when he used to be responsible for projects, his way of visualizing and tracking activity was drawing a progress chart on his whiteboard or, when he was on the road, creating a complicated spreadsheet. To him, Gantt charts were a stroke of genius.
“They look like they can manage a project for you,” he joked.
I wouldn’t go that far, but they can give you the resources you need to bring a project to a successful completion and restore faith in yourself after a major blunder. Nothing erases the memory of a bad career move like a succession of good ones. Thanks, Henry Gantt, I owe you one!

Rose Keefe is an author and technical writer who has over ten years’ experience in supporting project managers in the manufacturing and construction sectors. One of her primary responsibilities was developing product manuals that supported efficient use of industrial equipment. She continues to write on the subject of time management and commercial productivity for trade websites and publications.