You can create a timeline graphic in Excel by using the following methods:
- SmartArt
- Using a pivot table
- Scatter charts
- Timeline templates
In this blog post, we provide an in-depth, step-by-step process on how to create a timeline in Excel using all these four different techniques.
By the end of this article, you’ll learn how to make a project timeline in Excel to visually communicate your project’s schedule with stakeholders.
How to create a timeline in excel using SmartArt
For starters, what are SmartArt graphics?
SmartArt graphics timeline in Excel: for what purpose?
Microsoft Excel’s SmartArt tools make it reasonably straightforward to create a project timeline.
Now, while SmartArt timelines can be a valuable tool to communicate a project’s roadmap to stakeholders, they are also limited; you can only create simplistic timelines to visualize the milestones of a project.
In short, SmartArt timelines are okay for simple reporting purposes but not to work with.
Create your SmartArt timeline
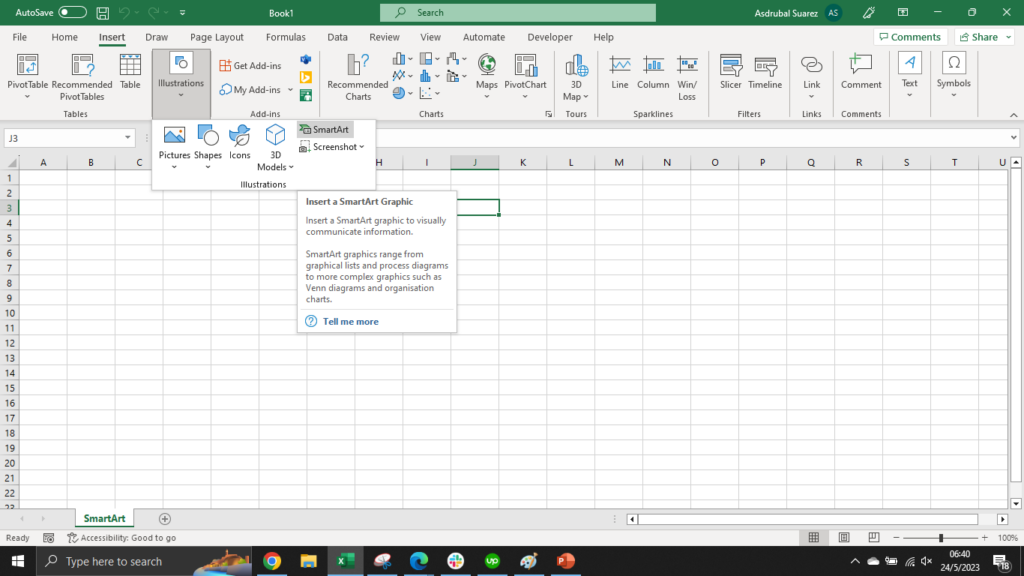
- Open a blank Excel worksheet. Click Insert tab > SmartArt > Process.
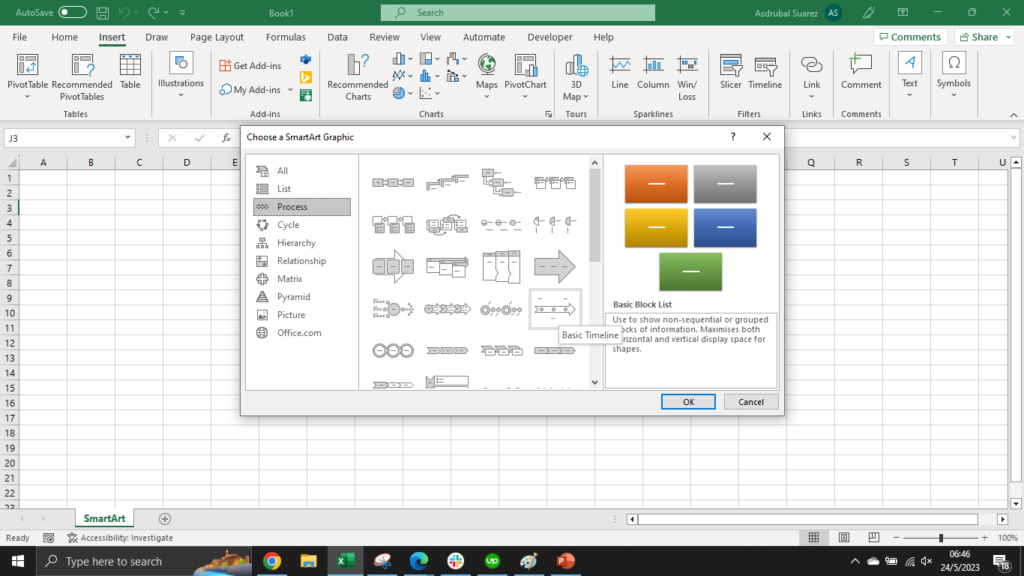
- Then select Basic Timeline from the Graphic options. You may also choose other graphics templates that suit your needs.
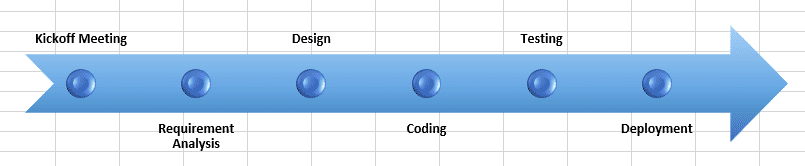
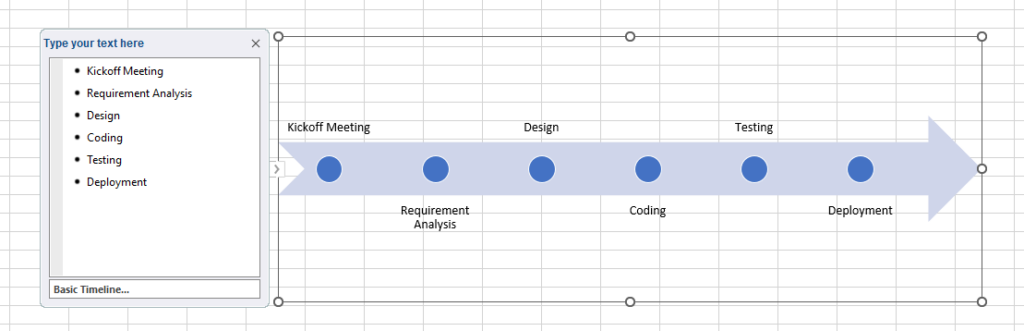
- Add data from the timeline (start date, milestones, end date, etc.) either in the provided text pane or directly on the timeline.
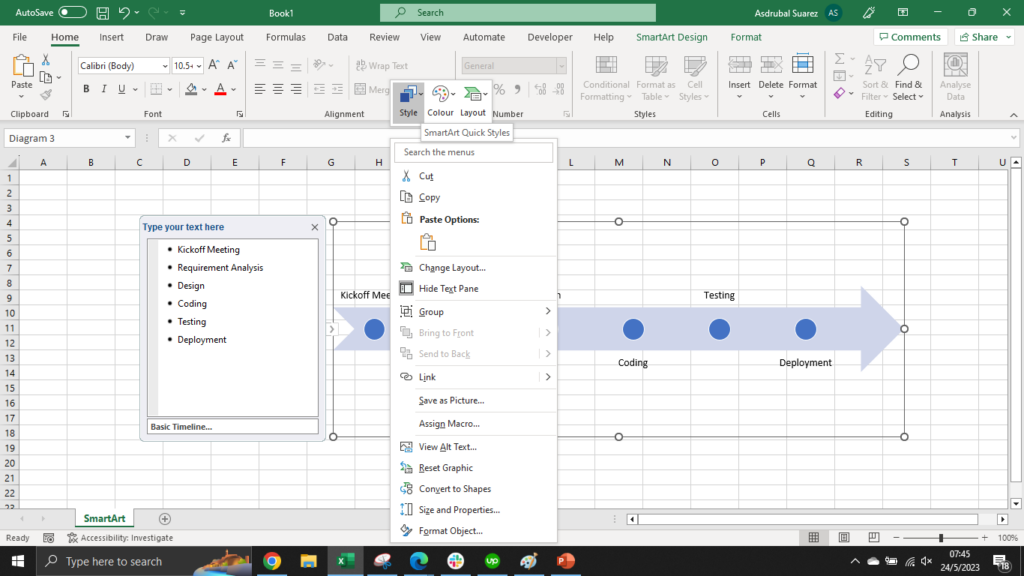
- Excel also allows you to change the style of a timeline. To do so, simply right-click to change the theme style, fill color, and outline styles.
And you’re all set.
Your simplistic Excel SmartArt timeline should be ready!
If you’re after something more usable than SmartArt, you may be interested in building a scatter chart.
How to create an excel timeline using a scatter chart
Creating a project timeline using Excel SmartArt may not be the best choice for your team’s needs.
Are you looking for something with a little bit more functionality?
If that’s the case, then scatter chart timelines might be more suitable for you.
Scatter chart timelines in Excel: why?
Scatter charts provide a simple way to visualize various data points over a specific period.
For instance, you could use a scatter chart to visualize the due date for all milestones of a project, along with the time or effort needed to achieve them.
This is something that a basic SmartArt timeline can’t deliver.
Here again, you can choose from and edit the many charts available in Microsoft Excel to represent a simple project timeline that will suit your needs.
In short: scatter chart timelines are a viable option to plan simple projects that don’t require much resourcing.
Create your scatter chart timeline in Excel
This guide is a bit longer, but stick to our steps, and you’ll be fine.
- First, open a blank Excel file.
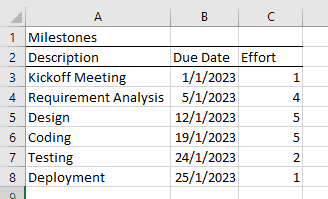
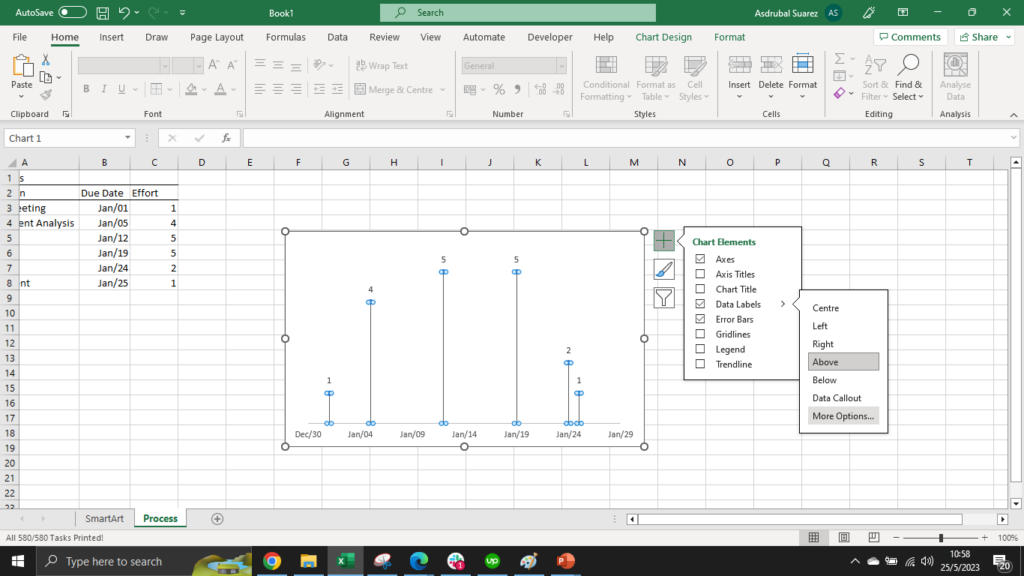
- Then, prepare your chart data.
For this chart, we’ll create milestones for a website design project and attribute a due date and an estimated effort for each.
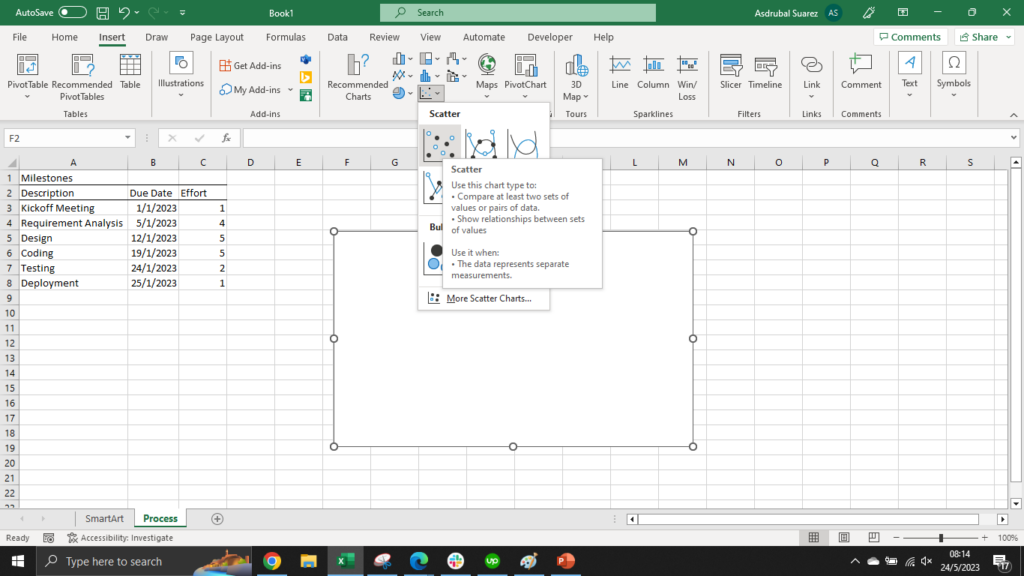
- Next, insert a scatter chart from Insert > Charts. Then select the scatter option.
Now, we need to map our prepared data to the chart.
- Right-click on the scatter chart. Then click the Select Data option.
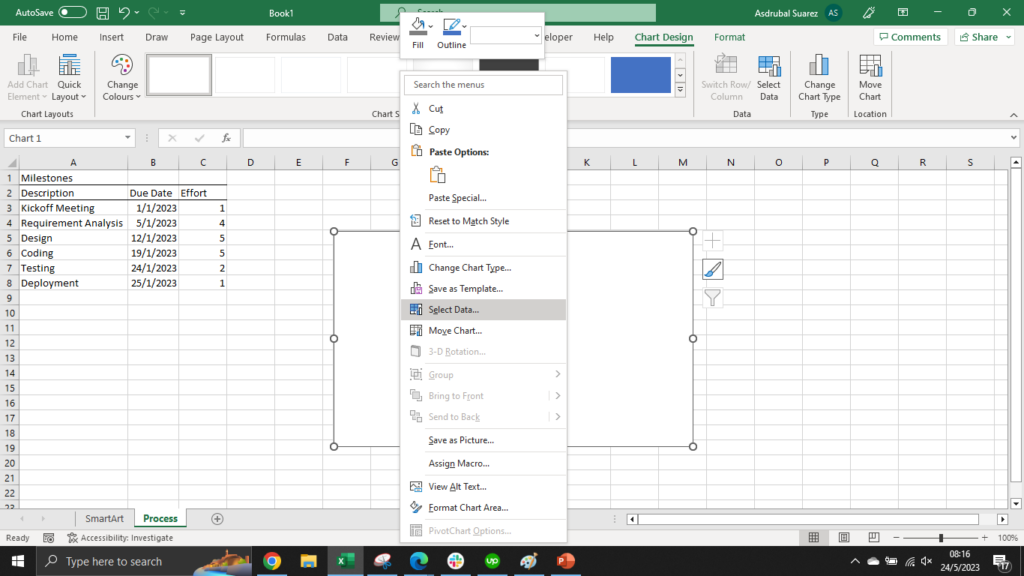
- In the dialog that pops up, click on the Add button in the Legend Entries section.
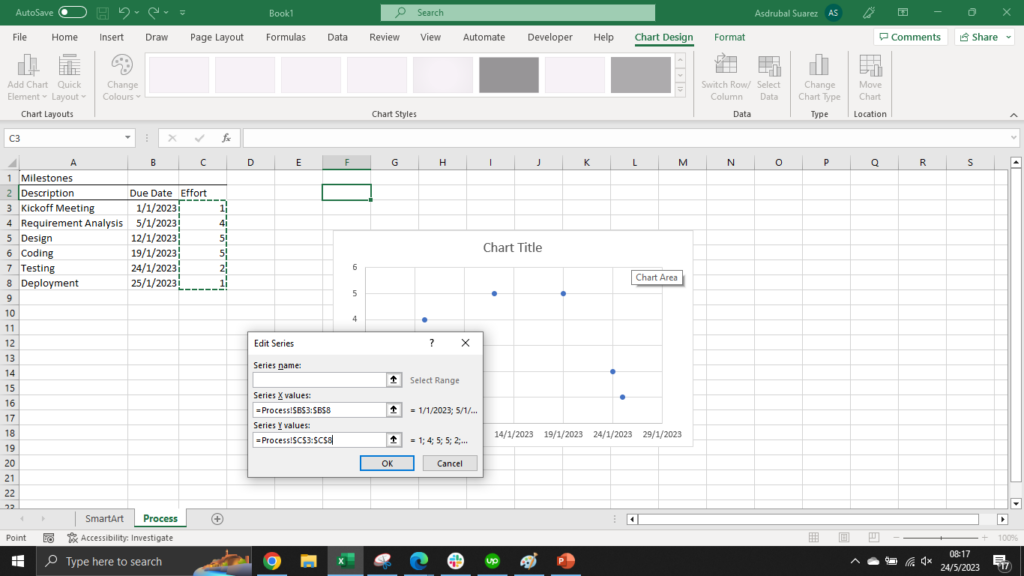
- Set the Due Dates range as Series X values, and the Efforts range as the Series Y values.
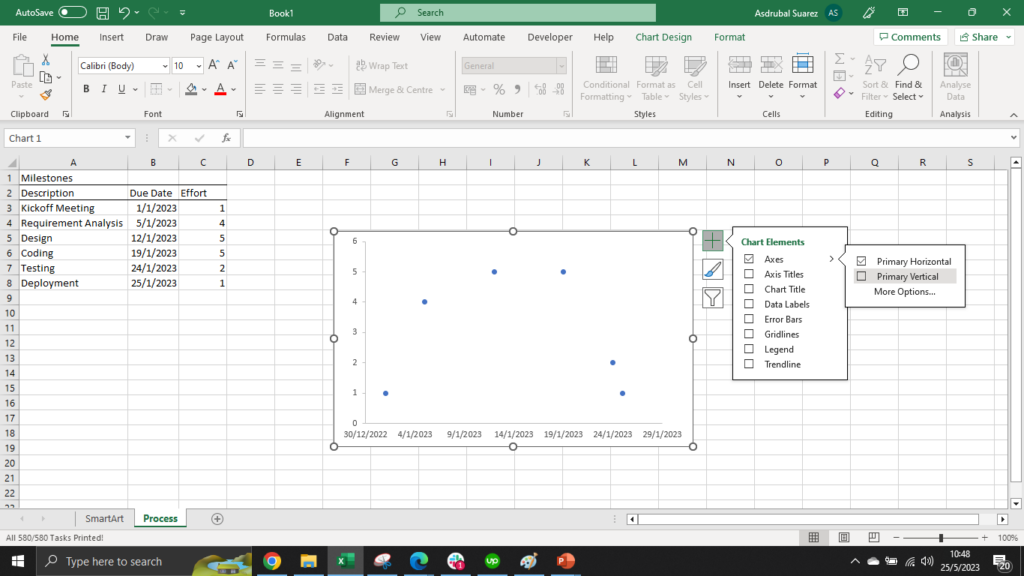
- Next, make our chart look like a timeline and disable the Primary Vertical Axis, Chart Title, and Gridlines chart elements.
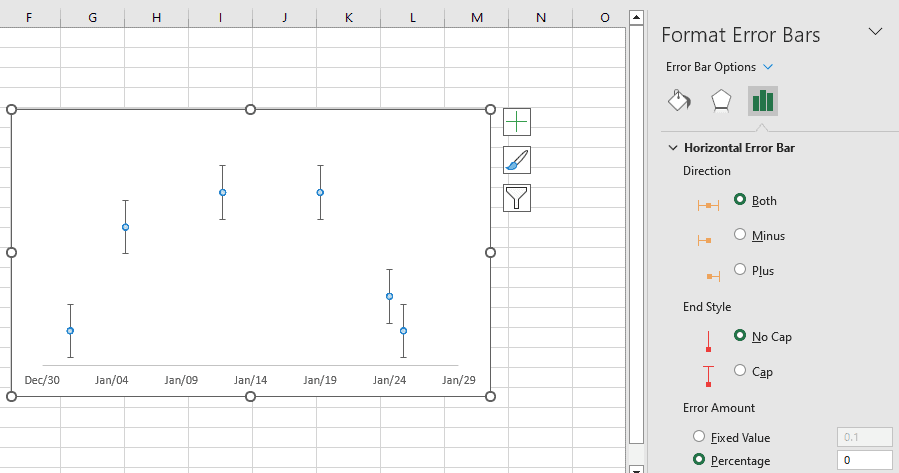
- To display the timeline markers, check the Error Bars option in Chart Elements.
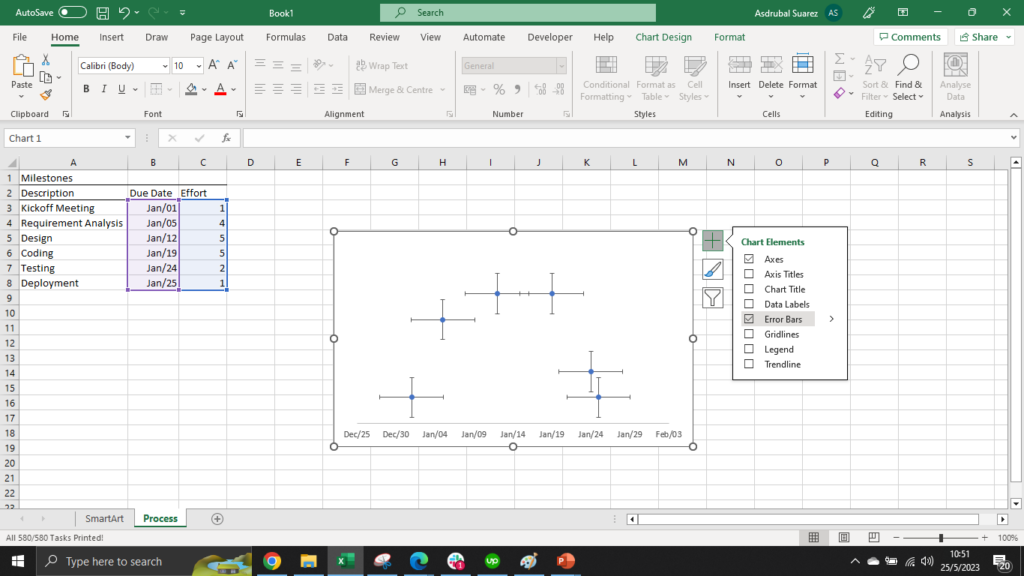
- Then to format the error bars, click on Chart Elements > Error bars > More Options.
- For horizontal error bars, set the End Style to No Cap and the Error Amount > Percentage to 0%.
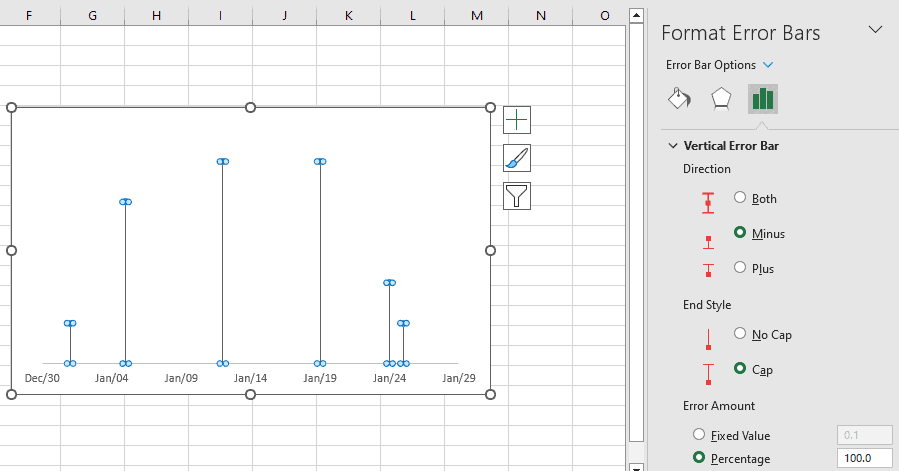
- For vertical error bars, set the Direction to Minus and the Error Amount > Percentage to 100%.
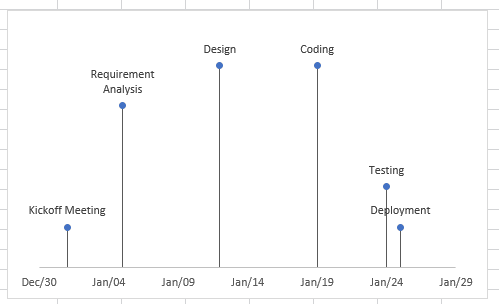
- To display the milestone labels, enable Data Labels from Chart Elements > Data Labels. Then click on Data Labels > More Options.
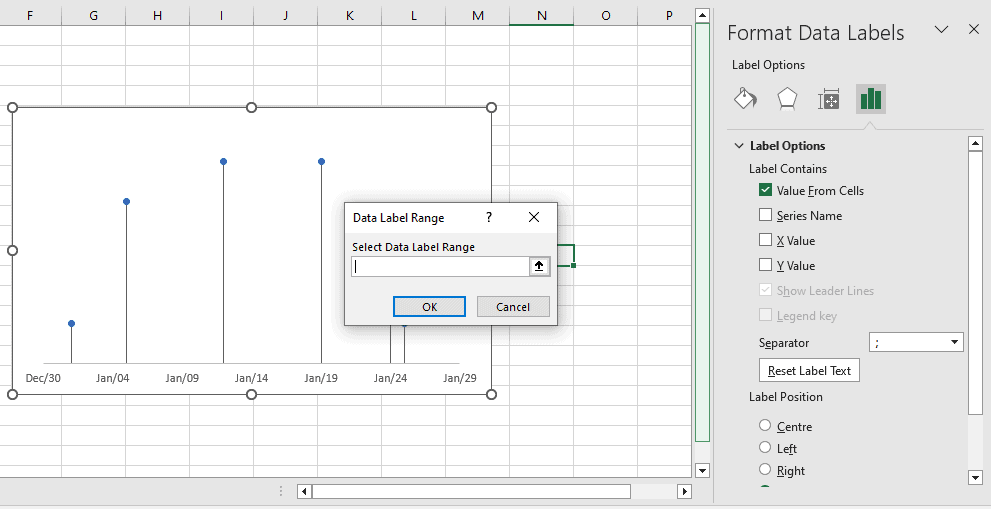
- Enable the Value From Cells option and select the range of milestone names from our prepared data. Uncheck the Y Value option.
Hats off to you! You made it! Your Excel timeline using a scatter chart is ready.
Now, if you don’t want to bother creating your own Excel timeline charts from scratch (I can’t blame you there) an alternative is to make your timelines using Excel templates.
How to create an excel timeline using pivot tables (and why)
Another way to create timelines in Excel is by using pivot tables.
Pivot tables timelines make it easier to visualize time-based data so you can plan your projects better.
You want more functionality than SmartArt timelines. But don’t want to go through all the steps listed in Scatter chart timelines.
Then Pivot Tables timelines might work for you.
Pivot tables timelines in Excel: why?
A PivotTable timeline in Excel lets you filter dates easily.
Instead of changing filters, you can use a slider control to focus on the time period you want.
It’s a dynamic tool that makes zooming in on specific dates simple and quick.
You can also customize your Pivot tables timelines. Move them around and easily, change colors, sizes, and styles.
Create your pivot table timeline in Excel
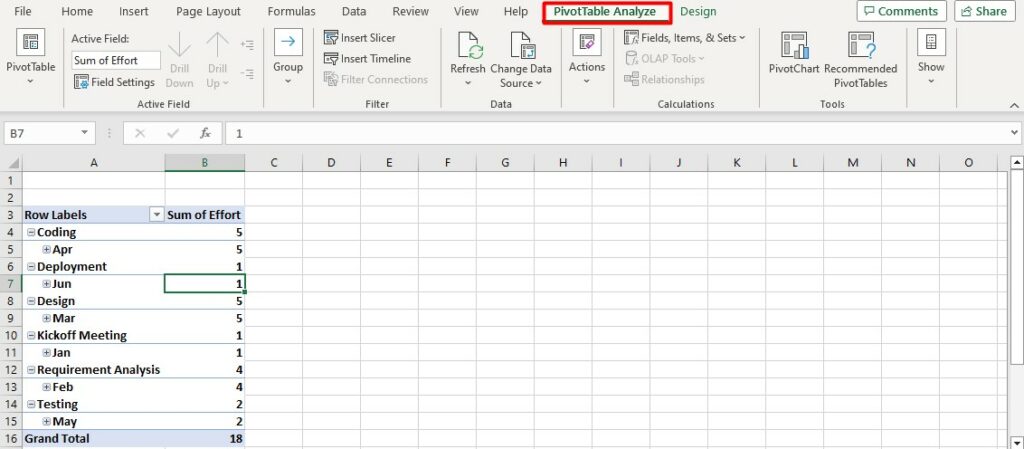
- To see the PivotTable Analyze tab, click anywhere inside the pivot table.
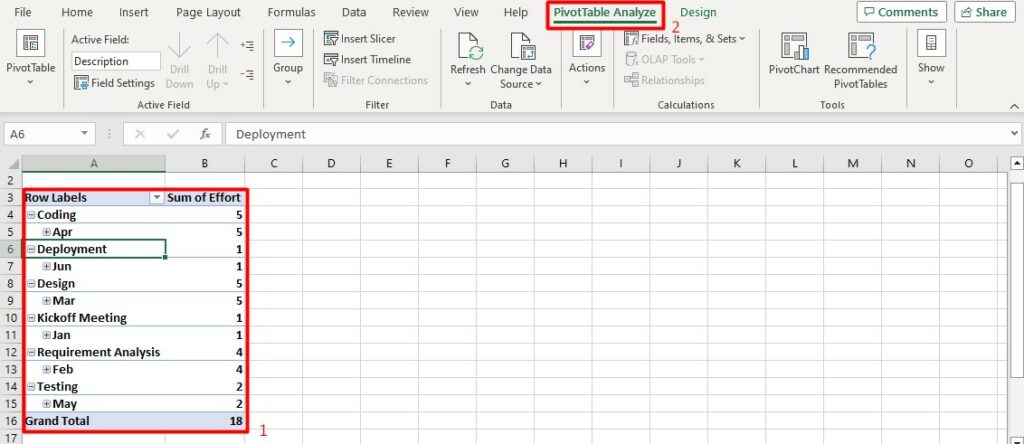
- Click on PivotTable Analyze to open the toolbar that lets you edit data inside the table.
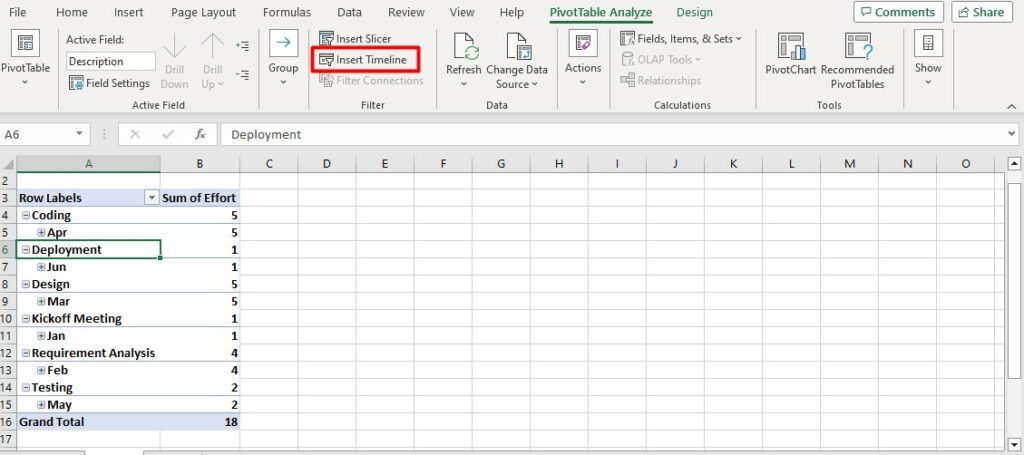
- Click on Insert Timeline.
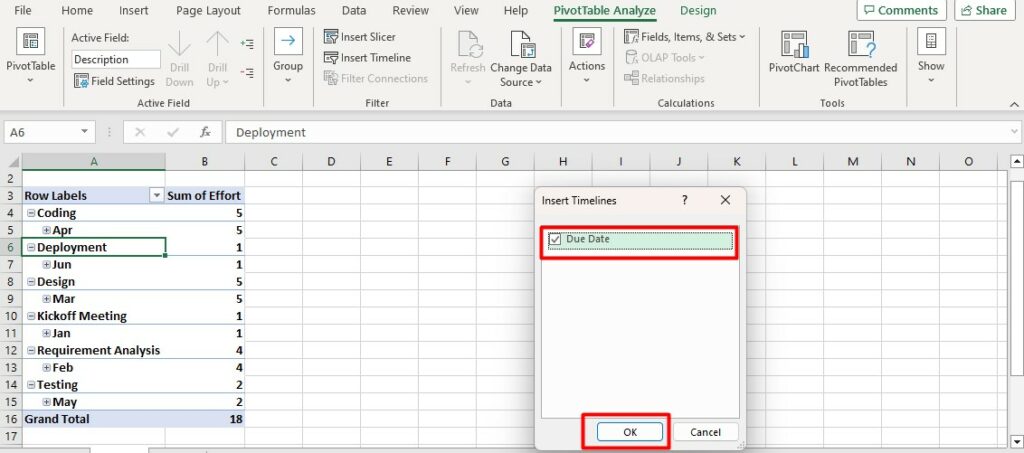
- A dialog box will appear that shows the fields corresponding to data formats. Select the applicable field and click OK.
- Click the arrow next to Months to select the filter scale.
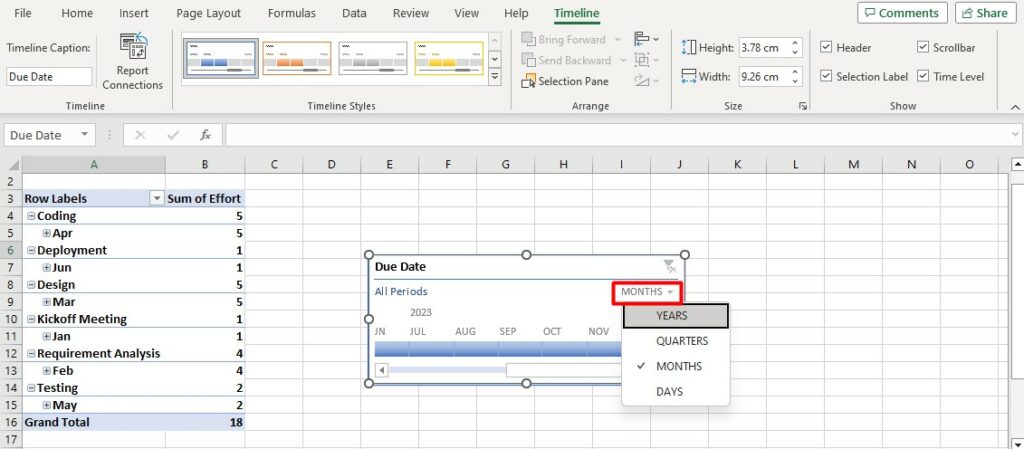
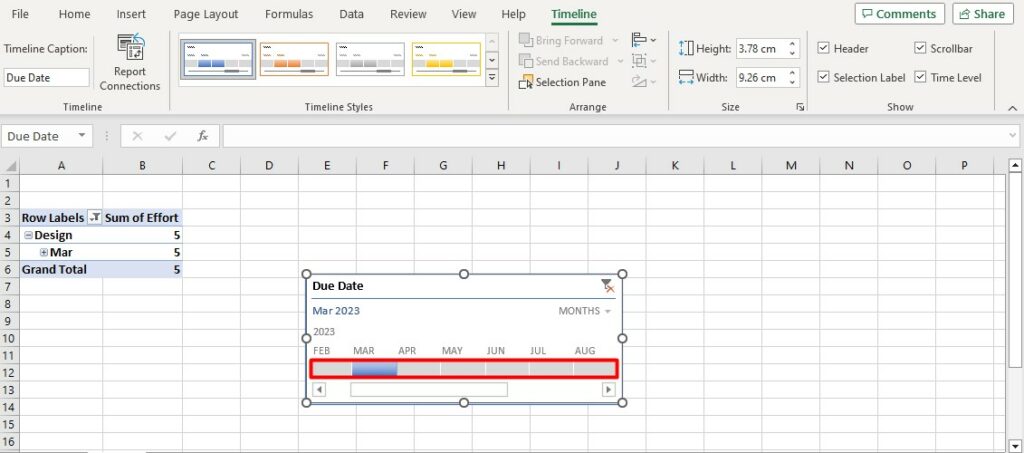
- Click a time section to see only data from that selected section.
To see more sections at once, click and drag the gray handles next to the section.
How to create a timeline in excel using timeline templates
Excel timeline templates are readily available in Microsoft Office’s Template Library.
Note that some of these templates will only be available once you purchase a Microsoft Office 365 subscription. However, the vast majority of them are available free of charge.
In short, use ready Excel templates to create simple project timelines to avoid building them yourself.
Let’s look at how to create a timeline in Excel using a template.
Create your timelines with Excel Templates
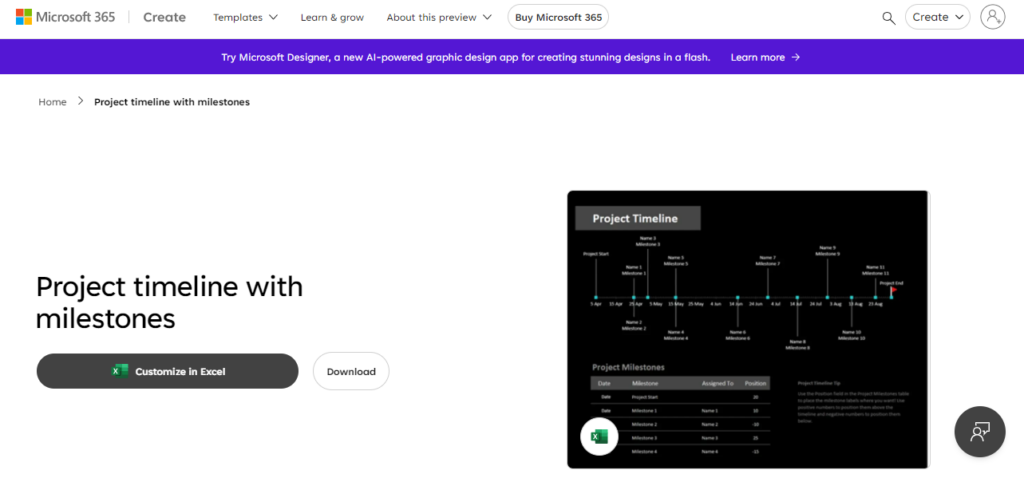
- Download the free “Project timeline with milestones” template from the Office template library.
- Open the downloaded template in Excel and update your milestone data in the Project Milestones section. Set the milestone due date, milestone description, the person responsible, and the milestone label position.
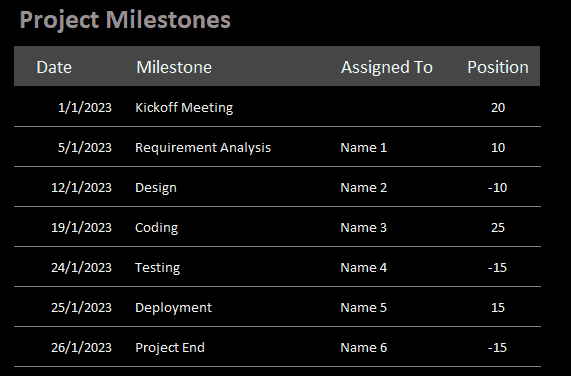
As you update your project milestone data, the milestone chart above it automatically updates.
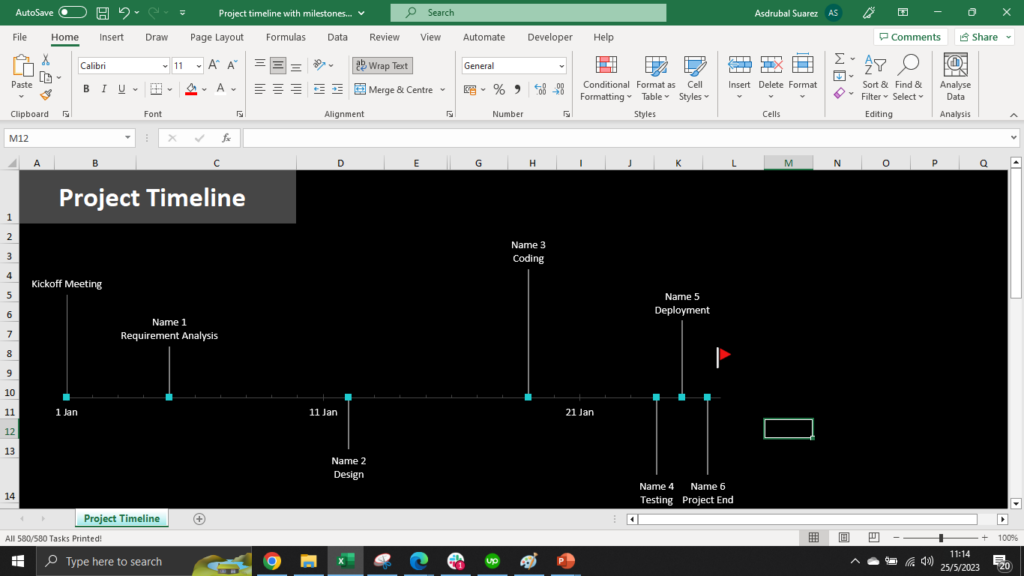
This is most likely the fastest way to build a decent timeline on Excel, especially if you don’t want to bother creating one from scratch on your own.
Now, you’ve probably noticed that while Excel makes it possible to create project timelines, it’s not ideally cut out for it.
Other downloadable Excel project timeline templates
If creating a project timeline by using Excel templates sounds good but you want some more downloadable templates to choose from, here are two great options.
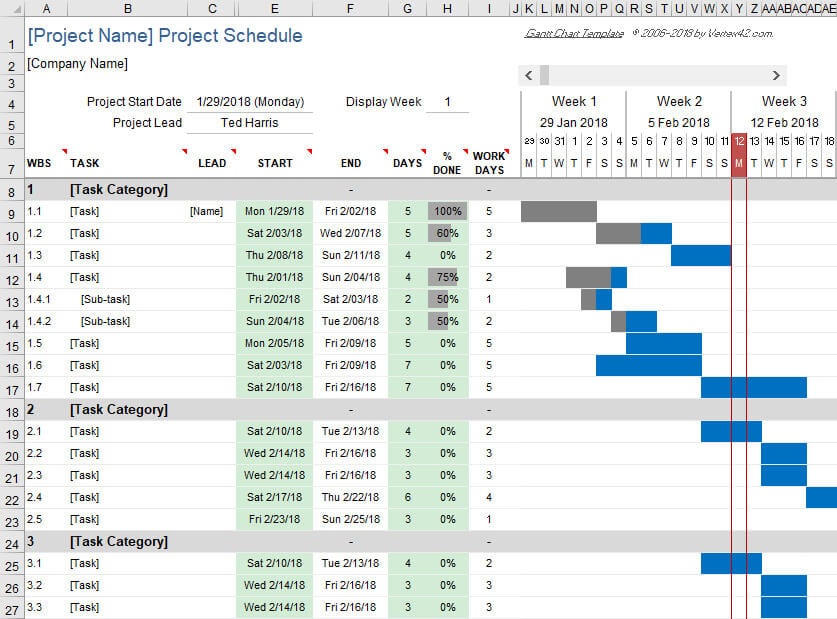
Gantt chart Excel template
This free Vertex42 Gantt Chart template allows you to create detailed project schedules in just a few clicks so you can rapidly kick off your project.
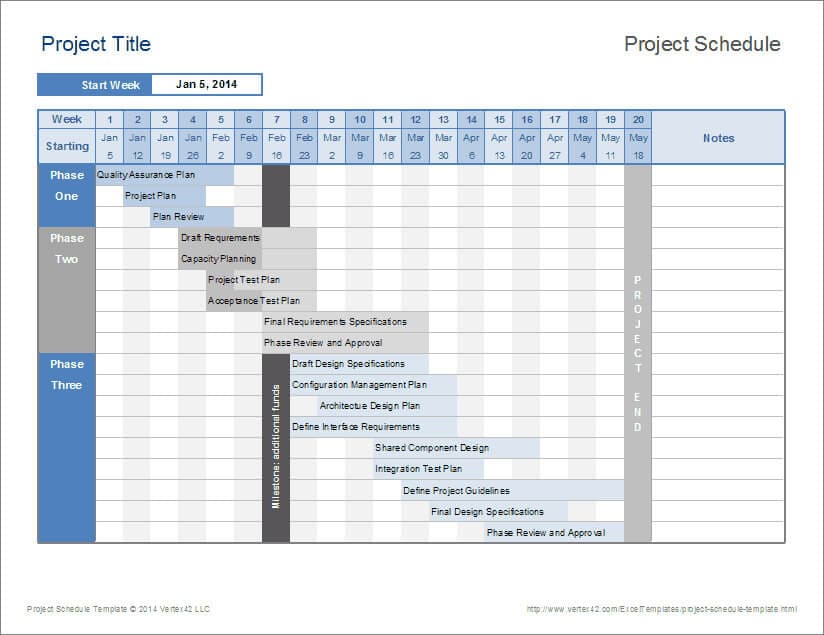
Project schedule Excel template
The second downloadable project timeline template that we have for you allows for great customization and provides a simple way to create project timelines.
With these free templates at your fingertips, you are now closer to creating efficient project timelines that boost productivity and organize your team’s workflows.
If you want to dig deeper into Excel timelines, here are some pros and cons.
Pros and cons of Excel timelines
As mentioned earlier, a timeline is a powerful visual tool for project managers.
In the early stages of a project, it helps to communicate a project’s roadmap. And in the later stages, it allows project managers to plan and track project schedules, allocate resources, and manage deliverables.
Pros of Excel timelines
The most significant advantage of using Microsoft Excel to create a timeline is that it’s easily available:
- Anyone with a computer, a smartphone, or a tablet can use Excel. It’s relatively affordable and doesn’t require a beast of a computer to run properly.
- You probably already have access to it. If you already have access to the MS Office Suite, you won’t need to spend anything extra.
- Your team is most likely Excel literate (up to a certain degree). If your team members are already comfortable using Excel, you won’t need to spend time training and onboarding them on the tool.
- You can find a ton of free Excel templates online. Using these templates, it’s reasonably easy to create a timeline in Excel.
Cons of Excel timelines
Don’t get me wrong; I love Excel (there’s a reason why I’ve decided to write this step-by-step blog post).
And if you are seriously considering using Excel as your project timeline maker, know that I’ve been in your position, and I’d rather tell you why it might drive you crazy.
- Excel lacks collaborative features. You cannot work with another team member on a project’s schedule unless you both sit right next to each other. As a result, it is tough for distributed teams to plan together.
- You can’t ensure data integrity. It’s (way too) easy for anyone to wrongly update or delete data from an Excel document, making it hard to keep track of who did what, where, and when.
- Version soup. “Oh shoot, I thought we were working from the Team Planning V12_new.xls?” Team members will eventually work on different versions of Excel spreadsheets. From experience, I know that combining data from these versions can quickly become chaotic.
To sum up, Excel is OK for small and simple projects. You will need something else for anything bigger because Excel timeline templates are too basic and aren’t really teamwork-friendly.
Easier Excel alternative for creating timelines
What about larger projects that require more complex functionalities?
For that, you may want to use a project planning tool like Toggl Focus.
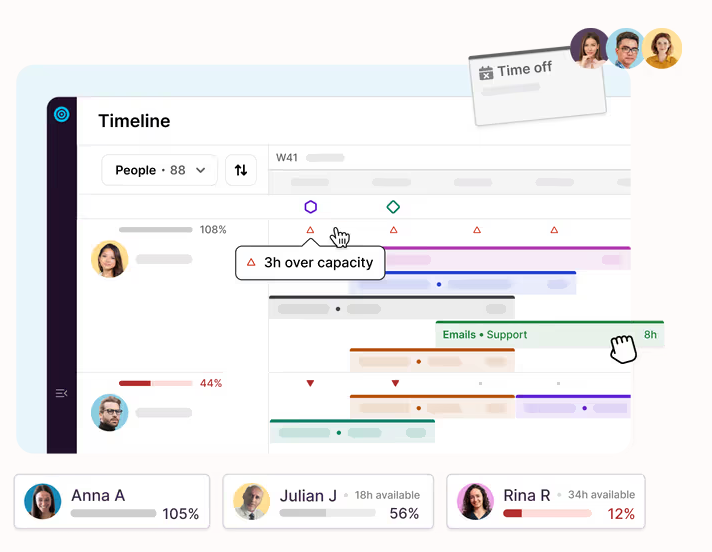
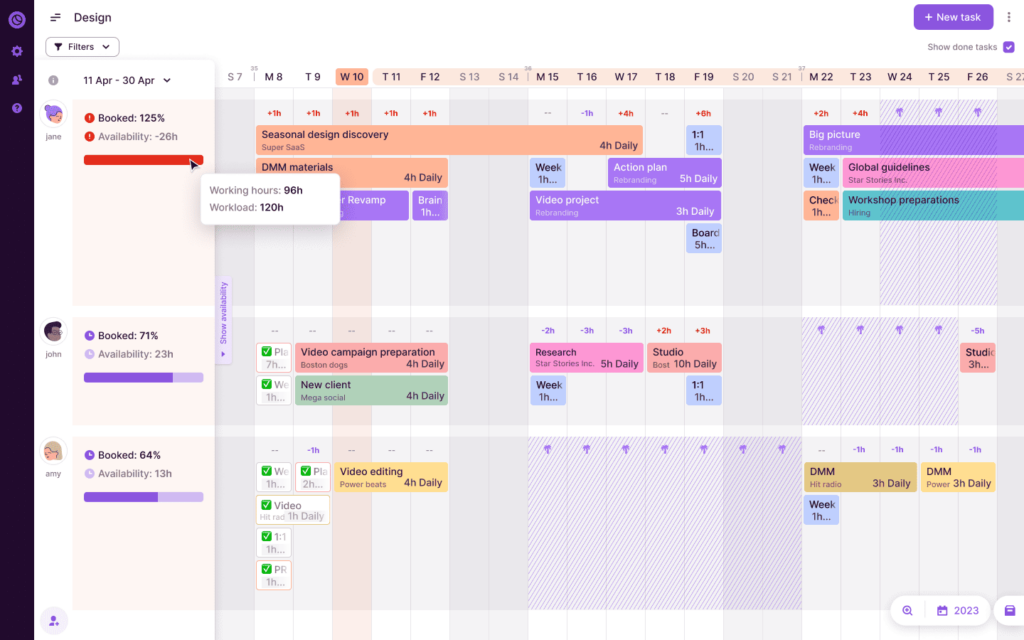
Toggl Focus is an easy-to-use SaaS with a drag-and-drop interface that provides a clear overview of who’s doing what and when, well ahead of time. Users can create visually appealing project timelines easier and faster so that teams work at capacity and deliver projects on time, without stressing about it.

Create beautiful timelines for complex projects
Excel’s timelines can be helpful — but they are too simplistic and can be darn hard to read. We built Toggl Focus’s timeline to become the only tool you need to plan and visualize your projects.
Don’t overwork yourself or your team
One of the advantages of planning well ahead of time is to anticipate how much work you and your team can take.
In Toggl Focus, you’ll be able to see how busy everyone is in the blink of an eye, thus making it more convenient to move tasks around and make sure that no one in your team works silly hours.
Collaborate with your teammates
While you can benefit from it as a single user, we actually built Toggl Focus for teams.
When working together, you can leave comments, create and assign tasks, move tasks around, adjust how long it took to complete a project, etc.
In other words, Toggl Focus enables teamwork.
Drag and drop your projects
While Excel is most likely the most comprehensive software out there, it’s not user-friendly. One of the things that I dislike most about it is the impossibility of just dragging and dropping items.
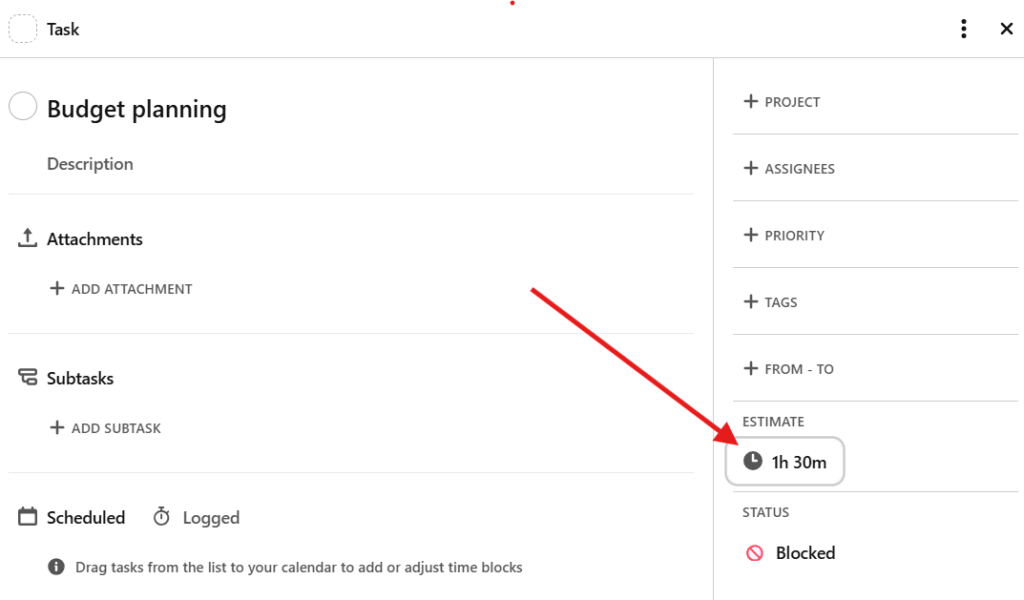
In Toggl Focus, you can simply drag and drop your tasks. Additionally, you can set an esetimated duration for every task. As your team starts tracking time, Toggl Focus automatically compares tracked time against your original estimates.
Painless. Fast. Easy.
Long story short, Toggl Focus makes project planning and work management bliss. Click here to try it for free.
Frequently asked questions (FAQs) about Excel project timelines
Q1. What is a timeline in Excel?
A timeline in Excel is a visual representation of data in chronological order created using multiple chart types like scatter charts or line charts. Excel timelines are simple ways to schedule and organize workloads for small teams that don’t require complex functionalities.
Q2. How do I create a Gantt timeline in Excel?
You can either do it manually or use a Gantt project-planner template for Excel and speed up the process.
Q3. How do I create a PivotTable timeline?
You can create a PivotTable timeline by clicking on a cell in your PivotTable and then on Insert Timeline in the Analyze tab. A dialog box with date fields will appear that you need to check and then click OK.
Q4. What is the difference between a timeline and a slicer in Excel?
A timeline only lets you filter data based on date or time values, while a slicer is a more general filtering tool that allows you to filter any type of data.

Elizabeth is an experienced entrepreneur, writer, and content marketer. She has nine years of experience helping grow businesses, including two of her own, and shares Toggl's mission of challenging traditional beliefs about what building a successful business looks like.


