You can’t pour concrete before the foundation is set. Nor can you launch a marketing campaign before all the assets are ready. When work must happen in a specific order like this, Gantt chart software is a tool you can use to visually map out the sequence of events and handovers.
This guide covers eight of the best Gantt chart software for teams, freelancers, and agencies, matched to different project types and planning styles.
Best Gantt chart software at a glance
| Tool | Best for | Free plan? | Paid pricing starts at … |
| Toggl 2.0 | User-friendly Gantt charts and timeline planning with time tracking | Yes (up to five users) | $9/user/mo |
| Tom’s Planner | Simple Gantt charts for freelancers | Yes (one project) | $9.95/mo |
| Instagantt | Asana users needing advanced Gantt features | No | $12/user/mo |
| GanttPRO | Baseline tracking and advanced sequencing control | No | $8/user/mo |
| TeamGantt | Cross-functional alignment on shared timelines | Yes (limited Personal plan) | $7/user/mo |
| ProjectLibre | Open-source desktop Gantt scheduling | Yes (open-source edition) | On-demand (Cloud version) |
| Jira | Software teams needing roadmap + timeline views | Yes (up to 10 users) | $7.91/user/mo |
| Wrike | Automation-heavy teams with structured workflows | Yes (limited features) | $10/user/mo |
What is Gantt chart software?
Gantt chart software is a planning tool that maps work against time. It uses horizontal bar charts to visualize tasks, deadlines, dependencies, and milestones on a shared timeline, so teams can see what, when, and in what order work has to happen.
At its core, Gantt chart software helps you:
- Sequence tasks logically so one delay doesn’t derail your efforts
- Spot bottlenecks and delays before they become project dumpster fires
- Align team members around key milestones and deliverables
- Track how performance changes or resource allocation impact the timeline
Overall, Gantt charts work best when tasks depend on one another and deadlines are iron-clad — visual sequencing brings clarity that boards and lists can’t. Gantt charts are especially useful for:
- New product launches: Coordinating feature development, QA, marketing assets, and go-live dates, all while managing dependencies between teams.
- Agency work delivery: Packaging multi-phase client work as a sequence of tasks, assigned to different contributors and tied to contractual deadlines.
- Construction or implementation projects: Scheduling contractors, procurement, inspections, and milestone sign-offs where tasks must happen in a strict order, and a Gantt chart helps you coordinate these moving parts.
6 key features of a Gantt chart app
Prioritize the following features in your Gantt chart software to make dependencies visible and show how small delays or resourcing bottlenecks can ripple across the entire timeline.
- Time tracking. Built-in timers, task estimates, and logged hours show how work progresses now and how it will evolve in the future.
- Multiple dependency types. Not all task relationships are equal. Look for support for finish-to-start, start-to-start, finish-to-finish, and lead/lag time if you need advanced sequencing controls.
- Critical path tracking identifies the tasks that directly determine the project’s completion date. If one of these slips, the entire timeline shifts.
- Resource allocation and workload views show who’s assigned to what task — and whether they’re overloaded. They reduce burnout and rebalance tasks before delays happen.
- Baseline tracking is essential for spotting schedule drift. This metric captures a snapshot of the original plan so you can compare planned vs. actual progress.
- Scenario planning lets you test “what if” changes before committing. Adjust timelines, resources, or dependencies to see how they impact delivery and cost.
The more schedule-driven your work, the more these features move from “nice to have” to non-negotiable.
Gantt charts vs. Kanban boards vs. timelines: when does each work best?
Here’s a quick summary table that shows how Gantt charts, Kanban boards, and timeline are useful in different situations.
| Method | Use it when … | Main advantage | Limitations | Sample use cases |
| Gantt charts | Tasks must happen in a strict order | Spotlights dependencies and work sequencing | Can be heavy to maintain and prone to over-optimization | Construction, product launches, system migrations, and regulated projects |
| Basic timelines | You need a clear visual overview of key dates | Gives a calendar-like overview of due dates and milestones | Limited sequencing control and resource management | Content pipelines, support teams, agile dev, marketing ops |
| Kanban boards | Work moves continuously through stages | Visualize task flow and limit work-in-progress | Poor visibility into long-term deadlines and task dependencies | Roadmaps, event overviews, executive planning snapshots |
When a Gantt chart won’t cut it
Gantt charts shine when sequencing matters, but sometimes, they’re pure overkill. For example, I don’t know any marketing teams that use Gantt charts to manage a content calendar because mapping every blog post or social media asset with dependencies is more work than creating one. Usually, a Kanban board is a better fit.
Typically, a Gantt chart isn’t a good fit if you’re handling work that changes regularly, such as:
- An inbox of customer support tickets
- A sprint or product backlog
- A bunch of ad hoc design requests
- Sales follow-ups and prospect outreach
- Internal ops tasks that pop up daily
Likewise, if your project is small, short-lived, or handled by two people who talk constantly, a detailed timeline might add friction instead of clarity. Sometimes a shared list or a simple timeline is enough.
And here’s the big one: if your team doesn’t naturally think in dependencies, forcing a Gantt chart on them won’t magically create discipline. It’ll just create resentment.
The bottom line: Use a Gantt chart when timing drives success. Skip it when flexibility drives momentum.
The 8 best Gantt chart software for different teams, projects, and use cases
Not all Gantt chart tools are built for the same kind of work. Some are lightweight planners for agencies juggling client deadlines. Others are heavyweight schedulers built for multi-phase enterprise programs.
Here are eight Gantt chart app recommendations, each matched to a specific team type, project complexity, and planning style.
Toggl 2.0: Best lightweight Gantt chart app with time tracking
Toggl 2.0 is a project and capacity planning tool based on a strong foundation of time tracking. Plan work on a visual timeline, then validate those plans against real logged time and actual team capacity. You’ll see exactly how work unfolds, so you can balance work allocation better and avoid missed deadlines.
Timeline-first planning experience
The Timeline is a simplified version of a Gantt chart.
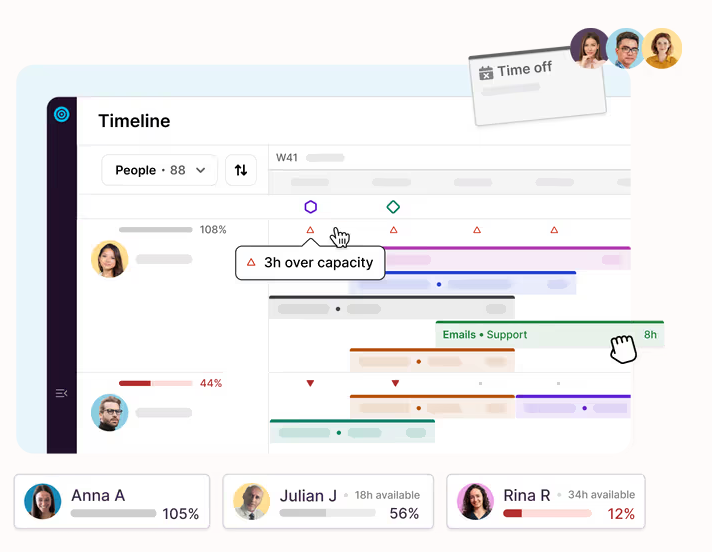
All tasks with assigned due dates automatically appear on the timeline. Drag unplanned work straight from the task list to your schedule, and use the collapsible sidebar for a cleaner, wider planning layout that lets you focus on sequencing without visual clutter.
As you plan, tooltips spot critical context at a glance: assignee, project, client, and dates.
For agencies managing multiple accounts and overlapping deadlines, seeing work laid out across a timeline reduces guesswork. You don’t just know what needs to be done — you see when, by whom, and with what downstream impact.
But Toggl 2.0 doesn’t shoehorn you into using only timelines. You can view tasks in several formats:
- My Tasks – a personal, calendar-based view for individual workload clarity
- List – a shared team view for broader coordination
- Board – for Kanban-style flow management
- Timeline – structured, Gantt-style scheduling
Recurring or one-off tasks can live comfortably in List or Board views. Meanwhile, you can schedule time-sensitive campaigns and tightly sequenced deliverables in the Timeline.
There’s no need to bend one type of work to fit another. The flexibility of Toggl 2.0 lets you run both structured, repeatable delivery and deal with ad hoc requests in the same system.
From planned work to measurable capacity
Once you’ve placed tasks on the timeline with deadlines and time estimates, Toggl 2.0 provides capacity insights. Color-coded capacity indicators show how close each team member is to their working limit:
- Grey indicates healthy allocation — roughly 70–100% capacity.
- Red flags significant over- or under-capacity.
The reports display workload imbalances in concrete terms, for example, if someone is sitting at +2 hours over capacity for the week. This feature identifies burnout risk before it becomes a morale or retention issue.
Real-time capacity visibility enables:
- Early intervention when workloads spike
- Smarter redistribution of tasks
- Protection against silent overtime
- More proactive hiring
See where time really goes — and what it costs you
Team-level report filters spotlight how time is spent across projects, tasks, and roles. That clarity supports more realistic future planning and better strategic decisions. For example, you can:
- Detect scope creep across accounts
- Stop overservicing demanding clients
- Identify high-effort, low-margin work
- Reallocate resources toward more profitable engagements
As custom billable rates can be assigned per task, project, or client, revenue logic becomes embedded in day-to-day planning. Your profitability data becomes visible within the same system where work is scheduled.
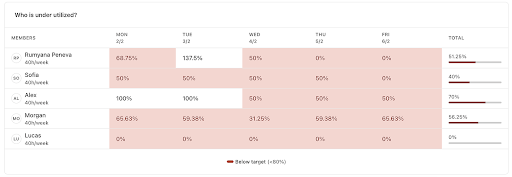
Utilization and workload reports extend the visibility further. You can compare logged hours against available capacity and defined targets, turning operational data into pricing, staffing, and retention strategies.
With Toggl 2.0, you get complete visibility into workload, capacity, and available resources, so you can deliver your best work without overloading your people.
| Main features | Use cases |
| Timeline (Gantt-style) view for visual project planning Board, List, and My time (calendar) views for flexible task management Recurring tasks for repeatable to-dos AI Task Creator to quickly structure deliverables from notes Capacity planning with real-time availability indicators Utilization reports with target-based tracking Color-coded workload insights (over/under capacity detection) Supported platforms: Web, Android, iOS, Windows, Mac. | Multi-service agency coordination (design, dev, strategy) Retainer-based agency workload management Quarterly resource forecasting and hiring planning Balancing billable vs. non-billable internal initiatives |
Pros
- Integrated time tracking that validates all plans based on real team capacity.
- Real-time, color-coded capacity indicators that instantly show workload distribution and over-allocation risks.
- Agency features like recurring tasks and custom billable rates.
Cons
- No advanced Gantt features like dependency management or critical path tracking.
- Automation capabilities are lighter compared to other tools.
Pricing plans
| Forever free plan | Starter | Premium | Enterprise |
| Free for up to five users | From $9/user/mo | From $20/user/mo | On-demand |
| Unlimited projects and tags Manual and automated time trackers Calendar integrations Focus mode Task and board views Timeblocking Task estimates and recurring tasks AI task creator Personal reports | Everything in Free plus: Timeline view Multiple assignees per task Milestones Guest access Team-level reports, with filters and billable rates Capacity planning tools | Everything in Starter, plus: Utilization and workload reports | Everything in Premium, plus: Personalized onboarding and a dedicated customer success manager Custom setup, integration, or reporting solutions Multiple workspaces under one organization |
Tom’s Planner: Best Gantt app for freelancers
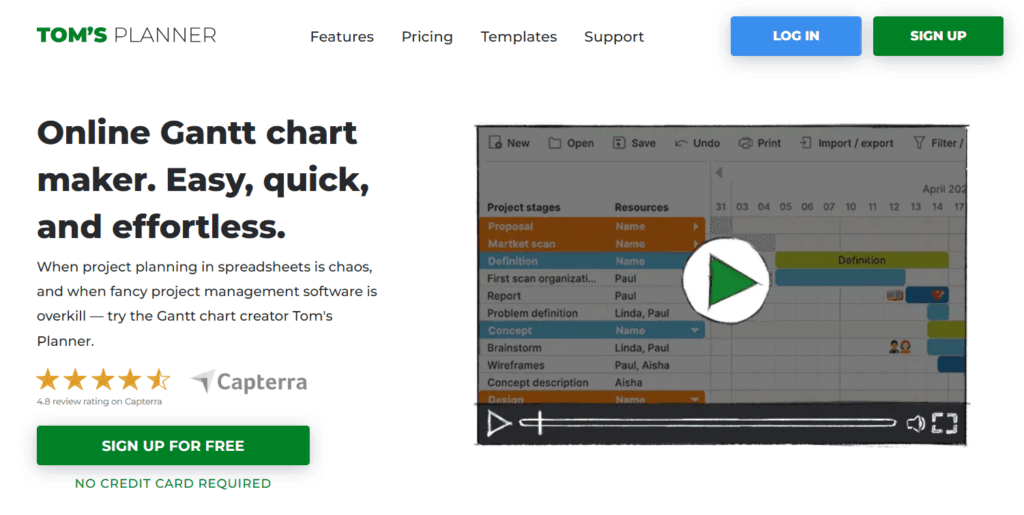
Tom’s Planner is a mono-feature Gantt chart app. It’s not pretending to be your task manager, sprint board, CRM, or resource forecasting engine. Instead, it’s an online Gantt chart maker — period.
The whole experience is built around visual scheduling. You can start with a blank canvas or choose from 530,000 user-created Gantt chart templates. From there, you’ll add color-coded time blocks to represent activities, stretch or shrink them with drag-and-drop controls, and stack your plan into a clean, scrollable timeline.
Want to mark priorities? Use icons, percentages, traffic lights, status indicators, or color coding. Task dependencies are equally straightforward to manage, so sequencing work doesn’t require a PhD in project management.
And that’s kind of the charm. There aren’t layers of extra features competing for attention. You get simple, editable timelines for personal use. Or if you want to share your schedule or have collaborators, update to a paid plan.
| Main features | Use cases |
| Drag-and-drop Gantt chart builder Track project progress with different indicators Simple task dependencies management Project timeline view over custom intervals Export and embedded schedules Supported platforms: Web-only. | Plan overlapping client deadlines to avoid double-booking Map out a personal goal plan. Coordinate an event or a new campaign launch Plan for seasonal business peaks |
Pros
- Tom’s Planner is universally praised for its ease of use. The UI is simple, and there’s literally no learning curve.
- Convenient board design, with the ability to hide the weekends, vacations, and other non-work days.
- Others appreciate the option to plan every month or down to the minute.
Cons
- Users are often frustrated with chart export options; PDF/PNG versions end up being barely legible.
- No companion mobile app to check things on the go.
- No way to merge schedules easily, so you’ll need to reconcile tasks manually.
Pricing plans
- No free trial available
- Free plan for one project
- 2 paid plans: Professional and Unlimited
- Paid pricing starts at $9.95//mo
Instagantt: Best Gantt chart companion app for Asana
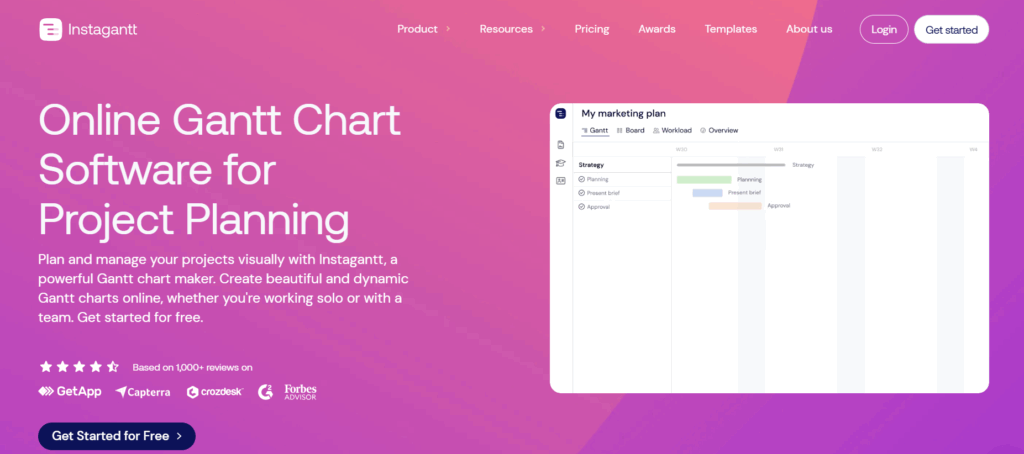
If you already use Asana as your core project management software but want more robust Gantt features, Instagantt is a great “add-on”. It layers task scheduling, workload visibility, and cost control directly on top of your existing workflow without forcing you to migrate tools.
Gantt functionality offers real depth through visual dependencies, baselines, estimated hours, and automatic task scheduling. Exporting clean PDFs is straightforward, which makes stakeholder updates feel like reporting, not busywork.
The Workload view (available inside the Gantt chart and as a separate report) adds a practical layer of accountability. It breaks down assignments across the team and shows who’s overbooked or underutilized. Workload calculations are based on estimated hours divided by task duration, rolled up into daily totals. When someone crosses the line into overload territory, their number turns red. It’s subtle but effective.
Cost control is baked in, too. The estimated cost combines variable costs — calculated from estimated hours multiplied by each member’s hourly rate — with any fixed costs manually entered per task. Instagantt automatically sums everything and allows direct comparison between estimated and actual costs.
As a standalone app, Instagantt expands beyond the Gantt view. Table and Kanban views allow flexibility for project groups and portfolios. A built-in task manager with comments inbox and drag-and-drop assignments keeps execution neat. Time-off management and a resource database add another layer of operational awareness, helping teams understand who’s realistically available to do planned work.
| Main features | Use cases |
| Gantt chart, table, Kanban, and workload views Visual, color-coded dependency mapping Critical path mapping and baseline comparisons Convenient task management system Workload management functionality Custom workdays and time-off management Supported platforms: Web-only. | Monitor capacity drift across recurring monthly deliverables Coordinate hiring pipelines and onboarding schedules Forecast labor costs for recurring service contracts. Balance workloads across multiple initiatives |
Pros
- Intuitive, easy-to-use, easy-to-read Gantt chart companion app for Asana, according to adopters.
- Users appreciate the effective budget control and calculation features.
- Automated task and chart generation also gets lauded as “high quality”.
Cons
- No mobile or desktop app versions available. The company also recently sunset a free individual plan.
- Exporting chart data to Excel or PowerPoint is not easy, and the result isn’t always accurate.
- Some users miss having a “company-wide vacation” control for time-off management.
Pricing plans
- No free plan
- 7-day product trial
- 2 paid plans: Individual & Team
- Paid pricing starts at $12/user/mo
GanttPRO: Best Gantt app for baseline and schedule control
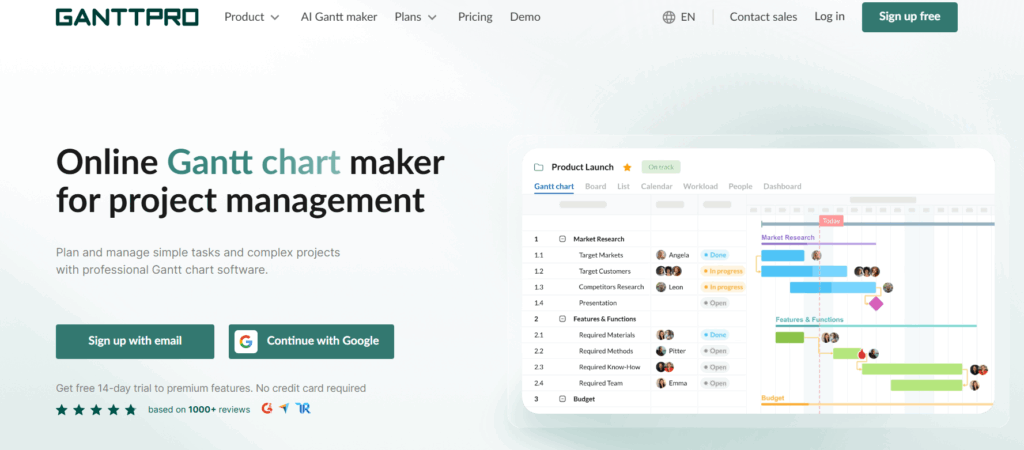
GanttPRO launched in 2014 and has evolved from a simple project scheduler to a fully-fledged project planning system.
The Gantt chart view is complete with dependencies, critical path calculation, baselines, and cascade sorting. You can model advanced sequencing logic by drag-and-dropping dependencies on the timeline or with task settings, using lead and lag relationships. The functionality is smooth, not fiddly, which matters when you’re juggling dozens (or hundreds) of tasks.
Auto-scheduling is another great feature. If you change a connected task or introduce a new dependency, the schedule recalculates automatically. No spreadsheet gymnastics required. Or you can switch this off if you prefer manual controls.
Beyond the Gantt itself, GanttPRO expands into additional views: Boards, lists, calendars, dashboards, portfolio overviews, and workload. In each, all planned tasks carry statuses, priorities, end dates, and custom fields. The workload view is particularly interesting as it helps with resource management. You can see who’s over/underloaded and shift things around. Resourcing feature covers multiple resource types, such as labor, materials, fixed costs, and also includes effort allocation tools. You can decide whether task duration should drive estimations or whether estimations should calculate duration, and GanttPRO will crunch the numbers automatically.
Overall, GanttPRO is a good choice for teams who need more than a pretty timeline, and also care about work sequencing, task timing, and effective resource allocation.
| Main features | Use cases |
| Gantt chart view with dependencies, critical path, and baselines Extra board, list, dashboard, portfolio, workload, and calendar views Convenient task management interface Task and resource auto-scheduling Comments & attachments in tasks Project and resource calendars Supported platforms: Web, Windows, Mac OS, Linux, Android, iOS | Construction project coordination Manufacturing production scheduling Consulting project delivery R&D programs management |
Pros
- Users praise the app for a solid balance between power and simplicity in everyday use, with the range of features being “neither too limited nor excessively complex.”
- Others rave about intuitive visualization of dependencies (auto-scheduling) and instant visibility into possible bottlenecks.
- Modern, clear layout with straightforward navigation is another strong point.
Cons
- No free single-user plan is available, and the paid trial period is rather short.
- Out-of-the-box integrations are few, with users asking for more options.
- Lacks features for tracking shared resources across complex projects.
Pricing plans
- No free plan
- 14-day product trial
- 4 paid plans: Core, Advanced, Business, Enterprise
- Paid pricing starts at $8/user/mo
TeamGantt: Best for cross-functional alignment
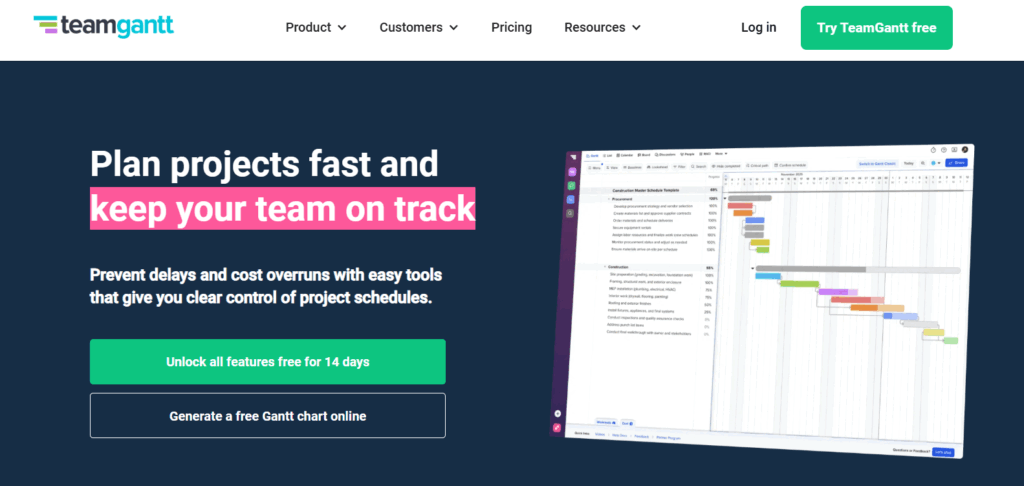
TeamGantt gives teams one shared timeline to keep people, assets, and deadlines in sync. It’s visual, structured, and unapologetically timeline-first, with just enough extra features to be more than “just another Gantt chart.”
Similar to Toggl 2.0 and GanttPRO, planning happens directly on the timeline with a drag-and-drop gesture. You can stretch tasks to adjust duration and connect them with dependency lines. Those lines show mishaps in your planning. If a successor task is scheduled inconsistently with its predecessor, the dependency line changes state, turning red like a polite but firm warning. This feedback saves you from scheduling goofs.
You also get baselines to stress-test your thinking. The app supports multiple “Planned vs. Actual” snapshots for comparing project progress. Critical path highlighting and task lists filtering help you further drill down into teams’ progress. Add custom lead and lag times when sequencing requires nuance, mark key milestones, and zoom in to track progress toward specific dates without losing the bigger picture.
Beyond pure scheduling, TeamGantt adds operational firepower with:
- Cost-loaded scheduling to forecast cash flow directly from the timeline
- Lookahead views for short-term planning focus
- Material lead time tracking to align procurement with execution
- Asset management for tracking equipment and spaces alongside people
On the reporting side, you get workload visibility across users and labels. At the project level, there’s a more granular availability view where you can drill into individual cells to see assigned tasks and hours. Project Health Reports and Time Tracking Reports supply extra insights.
Compared to GanttPRO, TeamGantt has more native integrations with apps like Trello, Procore, Slack, and Zapier, enabling further connectivity without coding.
| Main features | Use cases |
| Gantt, calendar, Kanban, and list views to track tasks Critical path mapping and advanced dependency management Unlimited chart exports and public share links Hourly estimating and team resourcing Workload management functionality Custom workflows and financial forecasting with the Builder add-on Supported platforms: Web, Android, iOS | Event production or event management Nonprofit fundraising campaigns Product rollout planning Facilities management |
Pros
- Most adopters rank TeamGantt as a comprehensive but easy-to-understand tool.
- Users appreciate how quickly they can organize tasks, set priorities, and modify deadlines.
- Others love the “expressive color bars that highlight the importance of the priority of activities and the level of progress in them”.
Cons
- Cloud-based app only, with no desktop version available for download.
- Some essential features, like dependency management, time tracking, and critical path mapping, are locked at the highest plan.
- Reporting features are relatively basic, lacking depth and detail, according to some adopters.
Pricing plans
- Personal plan for one project and one manager
- 14-day free trial
- Three paid plans: Basic, Business, Builder
- Paid pricing starts at $7/user/mo
ProjectLibre: Best open-source desktop Gantt app
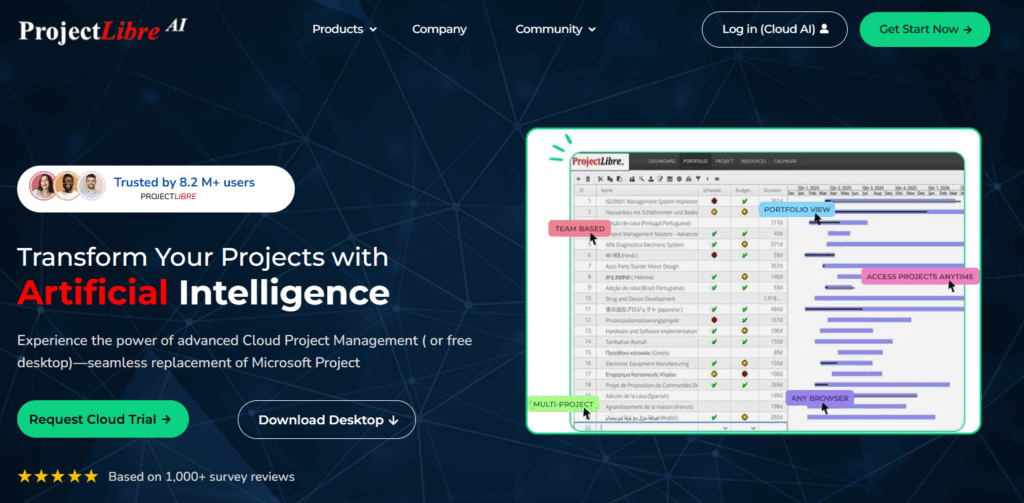
If you’re looking for a free, self-hosted alternative to Microsoft Project, ProjectLibre is the strongest contender. Although this app lacks the visual polish of some of its competitors (the views strongly resemble Excel), it’s packed to the brim with some great features.
The Gantt chart scheduling experience is functional rather than flashy. You can map out layered dependencies, set and track milestones across the project lifecycle, and optimize sequencing with network diagrams. Unlike others, ProjectLibre also offers convenient Work Breakdown Structure (WBS) functionality to divide the entire project into more manageable, hierarchical workblocks. This supports more effective work parallelism.
Resource management is a strong suit. You can assign and track resources across every task, then level them out to prevent one unlucky soul from being triple-booked while someone else coasts. Add baselines into the mix, and you can measure how work progresses in relation to the original schedule.
For those who prefer not to self-host, a Cloud edition is available, along with a newer AI Cloud version that adds a modern twist. Projects can be generated from natural language prompts in multiple languages, while advanced capabilities such as Critical Path Method, constraints, multiple baseline versions, Cost Performance Index, Schedule Performance Index, and predictive cost management bring earned value analysis into the mix.
| Main features | Use cases |
| Advanced Gantt chart features: dependencies, milestones, network diagrams, critical path mapping Work breakdown structures (WBS) and resource histograms. Multi-language interface Full interoperability with MS Project files Cost management and budget tracking features Supported platforms: Linux, macOS, Windows, and web for the Cloud edition. | Government or public sector projects oversight Academic research consortium projects Capital investment planning Phased rollout of complex software |
Pros
- Free access to the most important Gantt chart features, resourcing, and budgeting controls.
- Users praise the app’s printing capabilities; you can adjust the timeline scale and paper size formats.
- Others really appreciate the hierarchical organization of projects offered by this app.
Cons
- The app is positively function-over-form. The UI could benefit from a refresh, as quoted by a user, “it looks like a Win98 program”.
- Missing calendar customization is frustrating for some users.
- Limited real-time collaboration features are another common grievance.
Pricing plans
- Free, open-source edition
- 7-day free trial for a Cloud or Cloud AI versions
- Pricing on-demand
Jira: Gantt chart app for software development teams
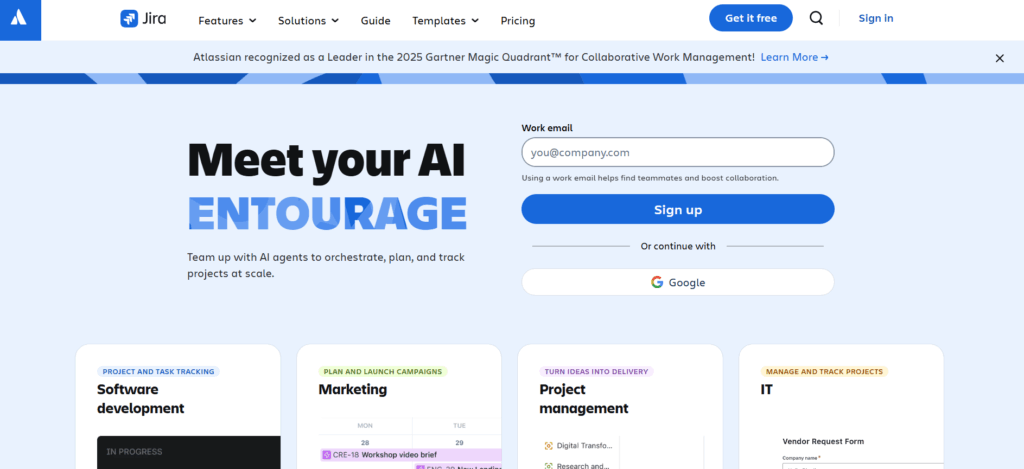
Jira is primarily known for being a Kanban board software, but it has a Timeline view hiding amongst a gazillion other features. It’s not a pro-level Gantt chart (maybe because Jira has been a long-standing advocate of Agile methodology, which is slightly-anti-Gantt), but it’s got all the essentials.
The Timeline visualizes timing, duration, and dependencies of work items in your project space. Each issue appears as a horizontal schedule bar mapped between its start and due dates, with bar colors reflecting its status. To reschedule work, drag and drop the entire bar to an open slot and the subtasks follow automatically. You can also drag items up or down to change priority sequencing, and link related work items to reflect dependencies. If something is blocked upstream, the relationship becomes visible in the timeline.
Extra project planning features are available in the Advanced Planning module, part of the Premium or Enterprise tier, which gives you access to extra features like:
- Cross-project dependencies to track progress and deliverables across different projects.
- Design custom issue hierarchies that map quarterly objectives down to daily tasks, and allocate work based on team capacity and timeframe.
- Use scenario modeling to test alternative delivery paths, compare best- and worst-case outcomes, and understand downstream trade-offs.
If your tech team already runs on Jira, upgrading may make sense for stronger capacity and dependency management. If you’re only looking for a clean Gantt app, though, Jira might feel like renting a commercial kitchen to fry one egg.
| Main features | Use cases |
| Feature-rich Kanban boards Extra list, timeline, calendar, and summary views Dashboards to visualize any data from the product Issue tracking and management Robust automation engine with custom logic Granular user roles and team security controls Supported platforms: Web, Windows, Linux, MacOS, other OS via Java JVM, Android, iOS | High-level planning around capacity and milestones Work coordination between business units that rely on each other. Manage deliverables sequencing for a new product launch. Build product roadmaps and distribute work. |
Pros
- Most users appreciate real-time visibility into progress, risks, and blockers, visible across projects.
- While implementation takes time, adopters like the degree of control you get over your workflows.
- Strong reporting features for tracking multiple project metrics and task assignments from one view.
Cons
- The most advanced Gantt-like features are locked on the highest plan tiers.
- Some users are frustrated that changes to due dates are forced for linked subtasks, which requires more tinkering to set things up properly.
- The overall product learning curve is as steep as an Olympic ski jump, as called out by multiple users.
Pricing plans
- Free trial available
- Free forever plan for up to 10 users
- 3 paid plans available: Standard, Premium, and Enterprise
- Paid pricing starts at $7.91/user/mo
Wrike: Best Gantt app for automation-heavy teams
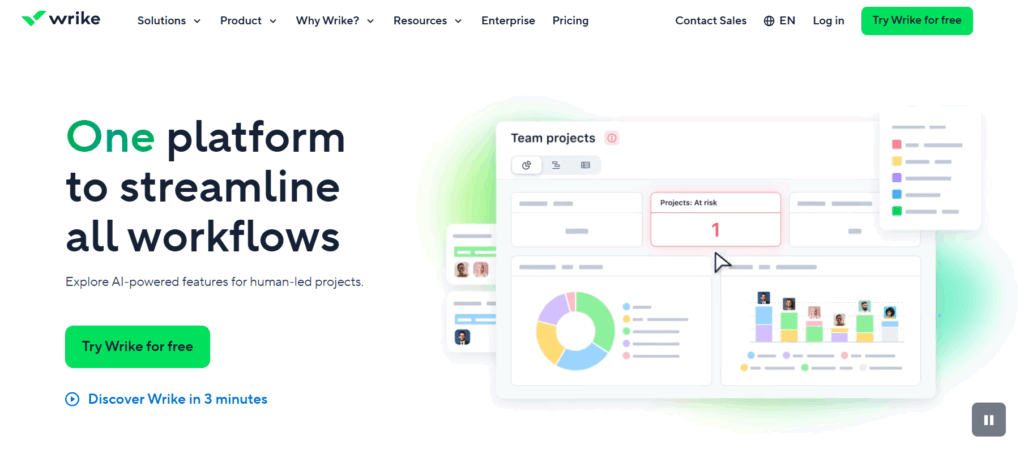
Wrike is a scalable workload management platform that combines Gantt charts, Kanban boards, lists, and calendars into one tightly controlled environment, with automation as the real headline act.
The Gantt chart view (available on paid plans) gives you proper dependency logic. You can link tasks together and successors automatically schedule after their predecessors — if you need to move one item, the timeline adjusts itself. Sprinkle in milestones to define goals or mark phase completions, and share your data with other stakeholders through public access links.
Where Wrike really flexes is automation. You can streamline workflows with a simple “WHEN this happens, THEN do that” logic, and no coding is required. Pre-built automation templates let you shortcut the setup, too. Once configured, all team members benefit from streamlined task assignment, optimized notifications, and automatic status changes.
On Business plans and above, users also get to sample Wrike Copilot — a built-in assistant that can summarize project data, generate reporting widgets, spot delivery risks, track dependencies, and spot highlights through natural language prompts. Annoyingly, automation and AI features come with separate usage caps, so power users should keep an eye on limits.
| Main features | Use cases |
| Dynamic Gantt chart and other views: board, table, calendar. Fully customizable workflows Resource and workload views AI and rule-based automation Build it yourself reporting dashboards Timesheets and time-tracking Supported platforms: Web, Windows, MacOS, Android, iOS. | IT service request management Corporate PMO operations Procurement workflows Multi-team program management |
Pros
- A great degree of app customization is what most users appreciate about Wrike the most.
- Reporting and custom dashboards are the common reasons why some choose Wrike over competitors.
- Customers also appreciate how Wrike doesn’t impose automation, allowing them to keep some legacy ones, running side-by-side with automated ones.
Cons
- Customer support is not the fastest, and responses can feel generic and unhelpful, according to some customers.
- Email notifications, especially from Wrike itself, often feel excessive to users.
- Others wish there were more priority alerts or automatic highlighting of critical tasks at risk of going sideways.
Pricing plans
- Free trial available
- Free plan with limited access to some features
- Four paid plans: Team, Business, Pinnacle, Apex
- Paid pricing starts at $10/user/mo
How to choose the right Gantt chart tool for your team
Gantt chart software is a dime a dozen, but only one tool will feel just right for your team. To find it, narrow down your research to three evaluation criteria:
- Team size. Small teams need clarity on priorities. Larger teams need permissions, workload views, and portfolio reporting. The more people involved, the more structure you’ll need in task ownership, permissions, and reporting.
- Project complexity. If your work depends on strict sequencing, milestones, and deadlines, Gantt charts make sense. But if projects are fluid and fast-moving, a Kanban app or list-based task manager may be enough.
- Budget. Look beyond subscription costs and factor in paid feature gates, onboarding time, training effort, and long-term maintenance to understand the real “price” of adoption.
Quick reality check: Gantt chart software isn’t for everyone. A lot of people won’t immediately “get” dependencies or critical path mapping, unless previously trained.
Also, timelines require regular upkeep, or they cease to be useful. If you don’t have a “Gantt champion” on your team to drive the upkeep and teach others, the interface will get messy or unrealistic (i.e., overstuffed) fast. If strict work sequencing isn’t mission-critical for your team, you may consider a project management method with less overhead.
Plan with precision using Toggl 2.0
Gantt chart software is a catch-all term. You’ll find everything from lightweight visual schedulers to advanced platforms with dependencies, baselines, workload balancing, and cost forecasting, marketed as one.
To find the best tool for your needs, consider the nature of your work. If your projects are deadline-driven, your team is juggling multiple clients, or your margins depend on accurate capacity planning, a basic timeline won’t cut it. Visibility without validation leads to overbooking and missed delivery targets.
That’s where Toggl 2.0 stands out. This intuitive platform gives you a clean, timeline-first planning experience, anchored by real-time capacity and logged hours. All plans are validated against actual availability in real-time, so you can easily compare task estimates against actual effort, notice workload imbalances early, and gently nudge sliding projects back on track.
Create a free Toggl 2.0 account to gain greater clarity in your planning.
Frequently asked questions (FAQs) about Gantt chart software
What is Gantt chart software used for?
Gantt chart software lets you plan and visualize time-based work like engineering roadmaps or multi-day event production. It maps tasks against due dates, shows dependencies between them, and highlights milestones, so you can move from reactive firefighting to proactive planning.
What is the difference between Gantt chart software and project management software?
Gantt software focuses on scheduling and sequencing, clearly showing how delays in one task affect others.
Project management software is broader. It may include task tracking, collaboration, budgeting, reporting, and multiple views beyond timelines. It’s designed to coordinate people, data, assets, communication, and execution, not just manage timelines.
Are there free Gantt chart tools that support dependencies?
Yes, two popular free Gantt chart tools that support dependencies are TeamGantt (cloud-based, web app) and ProjectLibre (open-source, desktop app).
When should you use Gantt charts instead of Kanban boards?
Use a Gantt chart when task sequencing and deadline adherence are critical for success. Switch to a Kanban board when you’re working on scope-flexible, fast-moving, or long-term tasks.
Use Gantt when:
- Tasks must happen in a specific order, such as in software migrations.
- Delays in one task will directly impact downstream work.
- Deadlines are fixed and non-negotiable, like before a major campaign release.
Use Kanban when:
- Work is continuous and iterative, like content production or support tickets.
- Priorities shift frequently, and tasks don’t depend heavily on one another.
- You’re managing a product feature backlog that evolves week by week.
What features should I look for in Gantt chart software?
Non-negotiable Gantt chart software features are easy work sequencing, full workload visibility, and milestone tracking.
Other nice-to-haves are:
- Task dependencies to link activities and auto-adjust schedules
- Critical path analysis to identify tasks driving completion dates
- Baselines to compare planned vs. actual progress
- Bulk rescheduling to shift timelines efficiently
- Import/export options for working with external data
- Cost tracking or budget controls if financial oversight matters
- Reporting dashboards for stakeholder updates
The right mix depends on your project complexity, but sequencing control and visibility into impact are must-haves.

Elena is a senior content strategist and writer specializing in technology, finance, and people management. With over a decade of experience, she has helped shape the narratives of industry leaders like Xendit, UXCam, and Intellias. Her bylines appear in Tech.Co, The Next Web, and The Huffington Post, while her ghostwritten thought leadership pieces have been featured in Forbes, Smashing Magazine, and VentureBeat. As the lead writer behind HLB Global’s Annual Business Leader Survey, she translates complex data and economic trends into actionable insights for executives in 150+ countries. Armed with a Master’s in Political Science, Elena blends analytical depth with sharp storytelling to create content that matters.