Your employees are your greatest asset, but are they also your biggest expense? In industries like investment banking, engineering, and healthcare, labor costs can hit $100 billion per year. Yet, companies in these fields also report some of the highest profit margins.
The secret? Maximizing your revenue per employee (RPE) rate. This important metric tracks how much yield each employee generates for your business and determines the effectiveness of your revenue generation relative to your workforce size, which is key for long-term, sustainable growth.
This guide reveals more about employee profitability. You’ll learn how to calculate your RPE with a simple formula (and several handy data collection and analytics techniques) to find new paths to profitability.
TL;DR — Key Takeaways
- RPE helps companies spot productivity gaps, process inefficiencies, resource allocation issues, and other blockers undermining revenue growth. You can justify labor costs by revenue and grow profit margins through operating model optimizations.
- Average revenue per employee depends on the company’s industry and years in operation — these factors are hard to change, but serve as a good benchmark. To maximize your RPE, focus on improving your operating efficiencies and employee performance.
- If you don’t know your RPE, you risk hiring for roles that don’t drive profitability while understaffing those that do. You may also choose the wrong performance management approaches, penalizing people for factors beyond their control, like poor workflow design or legacy software.
- The easiest way to track revenue by employee is to use time tracking data as a proxy (instead of just annual revenue and headcount). Continuous analysis with tools like Toggl Track can detect and debug process inefficiencies faster.
The importance of revenue per employee (and how to calculate it)
RPE is a strong indicator of your company’s efficiency. A low average revenue per employee means issues with your resource allocation, cost management, or pricing model. A healthier number means your operating model is in tip-top shape.
Company’s total revenue over 12 months / Current number of employees = Revenue per employee
Example: If your SaaS startup made $5 million in 12 months with 20 full-time salaried employees, your average revenue per employee is $250K.
The formula isn’t perfect because it doesn’t factor in other business costs, such as marketing, IT infrastructure, or equipment costs. It can also give skewed results if you have high employee turnover or rely on an external workforce, including freelancers or agency partners.
Still, it’s a good proxy for measuring employee productivity and overall operating efficiency. If your workforce has grown significantly, but your RPE has remained stagnant or declined, it’s a sign that inefficiencies or misaligned resources may be dragging down your profitability.
By tracking your RPE, you can diagnose these efficiency issues sooner (like suboptimal workload distribution, bloated org chart, and redundant business processes) and use that data to optimize your profit margins.
Factors that influence employee profitability
Several factors influence an employee’s revenue generation, from external market conditions to internal processes. Some factors, like industry trends, company age, or economic conditions, will be beyond your control. However, you can optimize your internal processes, work environment, and employee performance — three critical levers that can significantly impact RPE.
Industry
NYU Stern University runs a revenue per employee benchmark for US companies:
| Industry name | Average annual revenue per employee |
| Advertising | $47,996.17 |
| Apparel | $127.18 |
| Regional banks | $356,647.75 |
| Healthcare and support services | $184,232.63 |
| Food and grocery retail | $16,046.42 |
| Semiconductors | $204,829.80 |
| Software (internet) | $124,606.07 |
| Trucking | $24,528.77 |
| Total market average | $104,029.79 |
The numbers are all over the spectrum because of the differences in business models and workforce capabilities.
Finance services providers and technology companies have higher RPE because they can generate more revenue with fewer employees, thanks to an asset-light business model, smarter product distribution, and greater automation.
For example, Mastercard has an impressive $843,323 RPE because it built a scalable payment network for processing billions of transactions per year (and pocketing the interchange fees), while also using advanced automation and cloud infrastructure to scale operations without increasing headcount.
Apple has a $2.4 million RPE — the highest among Big Tech companies. Its ‘recipe for success’ combines premium pricing, an optimized global supply chain, and ample service revenues with minimal labor costs compared to hardware manufacturing.
In contrast, manufacturing companies often have modest performance indicators. Many depend on large physical footprints, including multiple retail locations, warehouses, transportation, and production facilities, each requiring high staff headcounts to keep the lights on.
Other factors like competitive pressures, market dynamics, or skills shortages can also cut into your RPE metric.
Company age
RPE typically correlates with the stages of a company’s life cycle. Early-stage companies often incur high costs because they need to quickly capture market share and acquire new customers. Customer acquisition costs (CAC) range from $787 to $3,665 for tech startups and $127 to $377 for online marketplaces.
They also spend more on recruiting new employees (cue higher hiring costs), expanding facilities (for physical operations), or developing new service offerings.
| Timeline | Annual recurring revenue per employee | Good | Great |
| First 12-48 months | Less than $1 million | $70k | $100k+ |
| 2-3 years | $1-$5 million | $120K | $185k+ |
| 3+ years | $5-$20 million | $150K | $215k+ |
| 5+ years | $20-$50 million | $175K | $245k+ |
Mature companies benefit from recurring revenue from customer retention, brand loyalty, or a subscription model. They also have more optimized workflows and a greater degree of automation, which drives higher profitability with relatively stable workforce growth.
But they may also see a reduction in revenue per employee ratio. Product competitiveness may change, leading to lower sales volumes, while manufacturing costs may increase due to inefficiencies or supply chain disruptions. For tech companies, legacy software can become a nuisance for operating efficiencies and productivity growth.
Employee engagement and morale
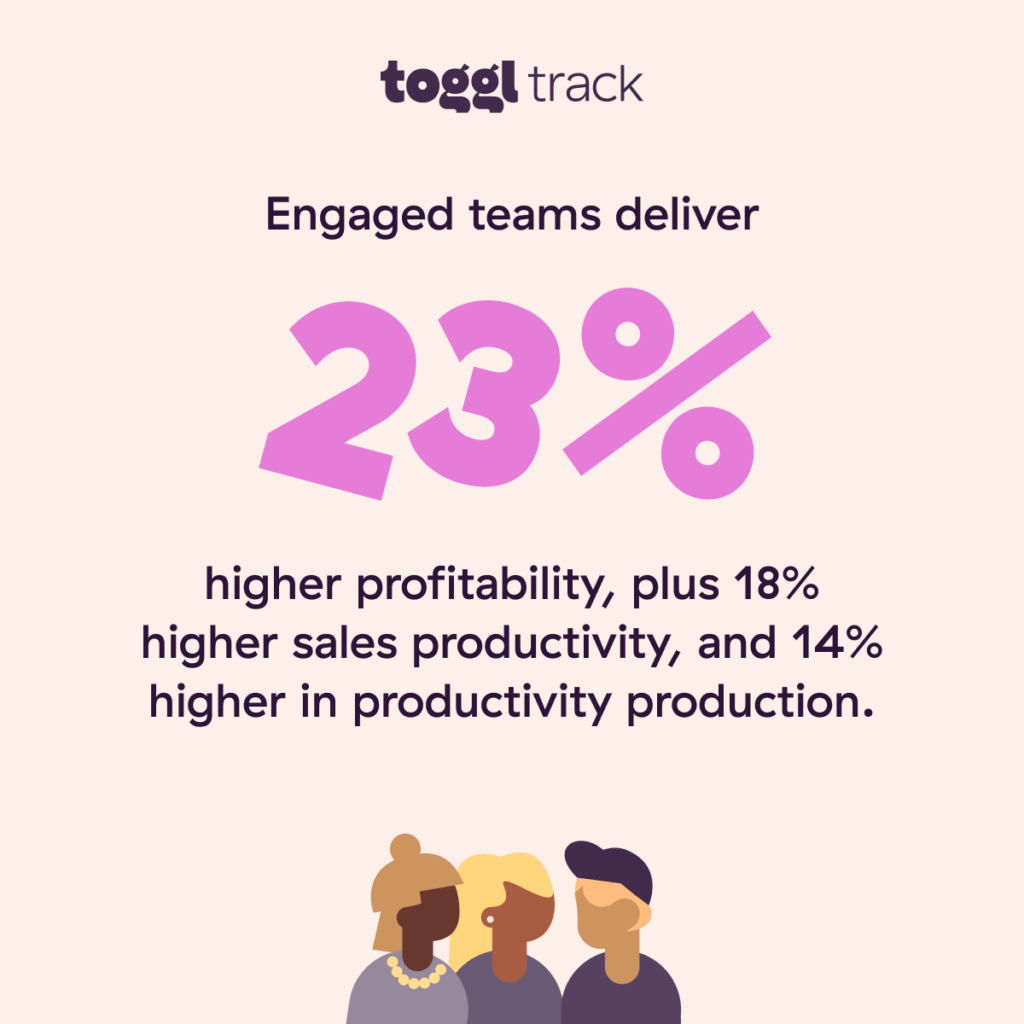
Disengaged employees are less productive. They’re more likely to show signs of absenteeism or ‘quiet quit’ when they complete the bare minimum expected of them. Unsurprisingly, employees who aren’t shooting for the stars produce lower revenue. But on the flip side, engaged teams outperform on several financial metrics.
Better recognition of employee contributions, a greater focus on work-life balance, and smarter workforce management are the first steps to improving employee productivity (and with it, your revenue per employee ratio).
Access to the right tools (Operating efficiency)
Small businesses that work smarter, not harder, outperform those with a bigger but less efficient workforce.
OnlyFans has 42 full-time employees but generates 13x to 28x the RPE of other Big Tech companies. While their saucy industry 🌶️ is a factor, they’ve also developed massive brand awareness through influencer marketing and a lean product development lifecycle.
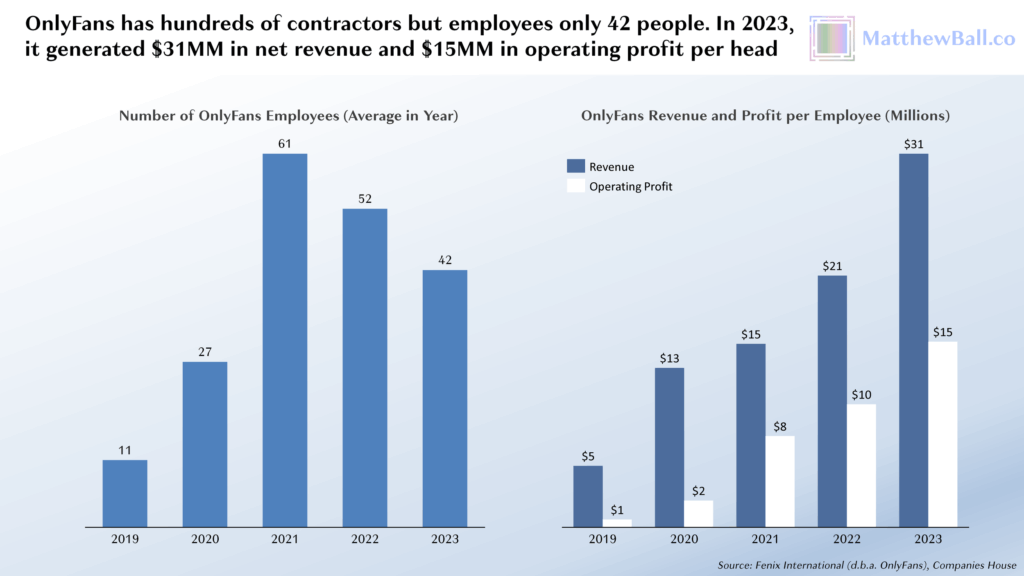
A huge part of OnlyFans’ success was the team’s ability to quickly develop and test product features and scale infrastructure to accommodate traffic spikes. Instead of increasing its number of full-time employees, OnlyFans asked contractors to help during peak growth stages.
While technology was key to the growth of OnlyFans, it’s the cause of major bottlenecks in other companies. Gartner reports that 47% of digital workers struggle to locate the information they need to perform effectively in their jobs. Meanwhile, 32% of middle managers in New Jersey firms name ‘inefficient processes’ as the biggest time-wasters.
Time analytics tools like Toggl Track reveal inefficiencies that chip away at your revenue. You can identify manual, time-consuming processes, remove redundant tasks, ditch unproductive routines, and direct your people’s focus toward revenue-contributing goals.
The dangers of not knowing your RPE
Warning: Ignoring revenue per employee could send your business waaaaay off course. This powerful metric ties workforce productivity directly to your bottom line. Overlook it and you might end up overhiring or bleeding profits before you realize it.
Let’s say Company A generated $500K in revenue last year. Its people seemed busy (according to timesheets), so the CEO hired two more designers. But because the company took more time-consuming projects without adjusting billing rates, its revenue decreased to $300K and RPE to $20K.
Company B also made $500K last year — how about that for coincidence? They hired a new software developer to implement RPA tools (spending more on licenses). But the new system improved sales deal flow, allowing the sales team to close accounts faster — and accountants to service clients better. The company’s revenue rose to $800K and RPE to $80K.
Not knowing your revenue per employee (RPE) leaves you vulnerable to:
- Resource waste: You may overhire for low-revenue roles while understaffing profitable projects.
- Misaligned priorities: People unknowingly focus on tasks that drain profitability, slowing your revenue growth.
- Hidden underperformance: Low productivity can lurk beneath the surface, masked by busy work. Without proven data, it’s hard to determine the trigger — perhaps process inefficiency, lack of skills, or dwindling employee motivation.
The above eventually leads to poor scalability, shrinking profit margins, and rising employee turnover rates as high performers grow frustrated by the internal chaos.
Think of RPE as your early warning signal for preventable inefficiencies if you act fast.
How to track revenue per employee (and improve it)
Revenue per employee is a proxy number for employee efficiency, which is a combination of high personal effectiveness, good project management, and optimized workflows.
To track RPE, you need detailed data on:
- Employee time
- Workload allocation
- Outputs towards revenue
Toggl Track gives you visibility into all these metrics (and more) through pre-made and custom analytics views. From here, you can use the collected data to figure out the best approach to optimizing your RPE. Here’s what worked for us and our users:
1. Start by tracking accurate time data
Financial statements and annual reports deliver insights on your revenue growth, net income, and profit margin. But accounting docs don’t exactly tell how productive different activities are — time tracking data does.
Time tracking data shows where your people’s focus lingers and how much valuable output an average employee produces. For example, if your salespeople spend hours on manual client prospecting and lead qualification instead of nurturing or closing deals, you’re leaving money on the table. Similarly, if your engineers are stuck in unnecessary meetings or constantly blocked by delays on the design side, you’ve got to work on better cross-functional collaboration.
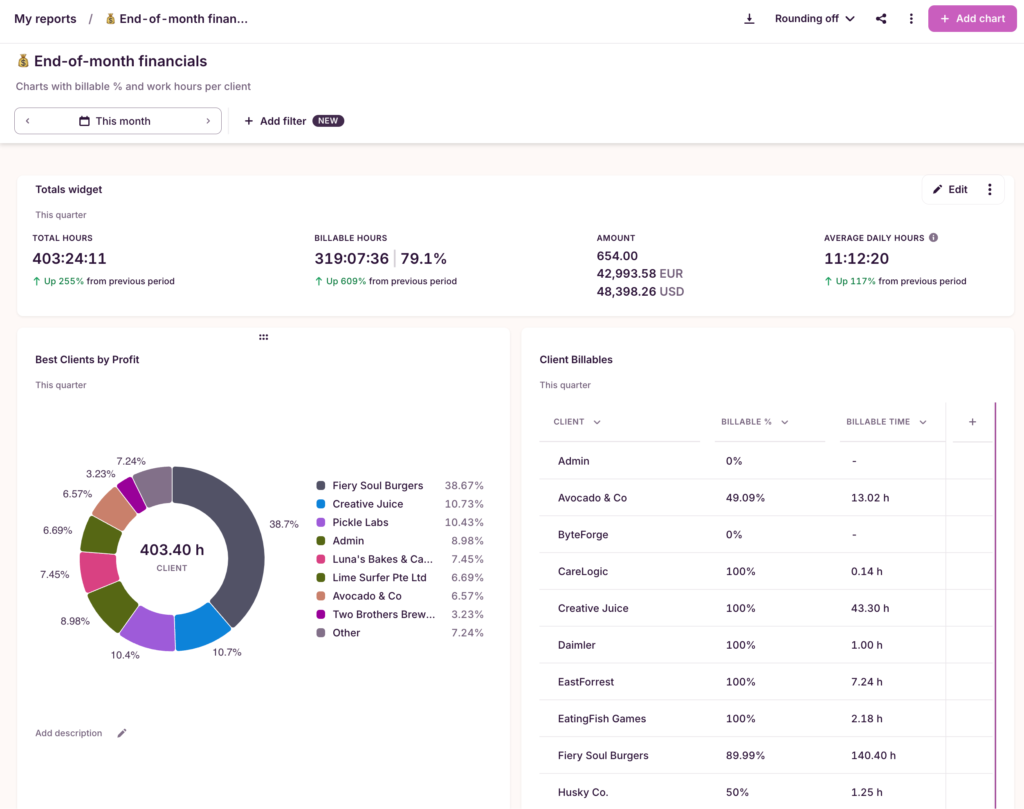
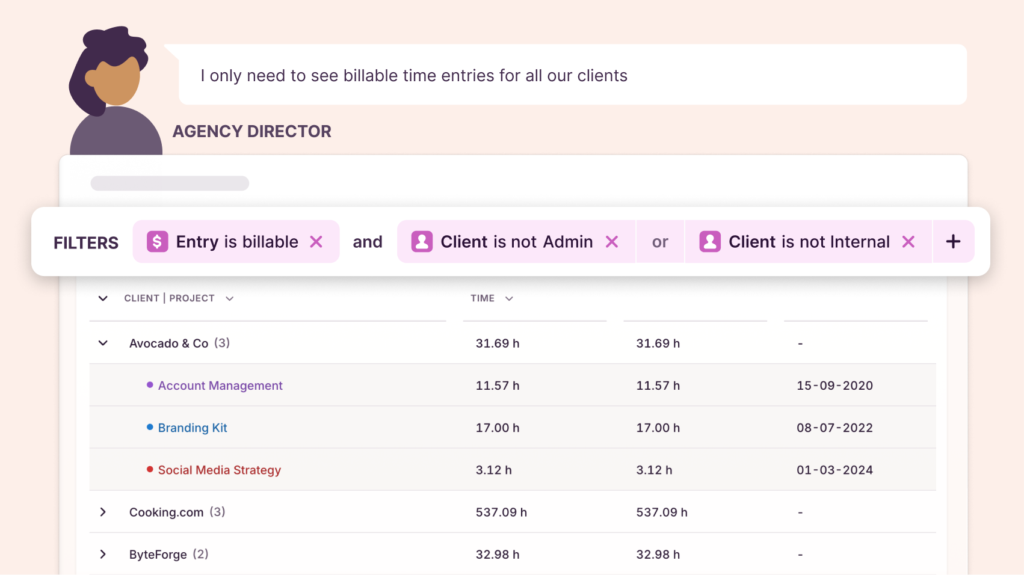
With Toggl Track, you can track billable vs non-billable hours, monitor project task progression, and predict delays on actual employee data.
This data identifies process bottlenecks, optimizes resource allocation, streamlines client billing, and better tracks profitability across specific projects to understand exactly how employees contribute to different revenue streams.
2. Analyze profitability using Toggl Track’s Analytics
When you know where your time and money is going, you can better predict your revenue.
With Toggl Analytics, you can easily calculate costs and profits for every type of project through logged billable hours, employee activities, and expenses. You can model future profitability trends with budget forecasting, estimated vs. actual, and income vs. expense reports.
PR agency Sweat+Co juggles a lot of clients and projects. But they had no idea how much time and resources different tasks take…until Toggl Track. After implementing our tool to record billable hours, Sweat+Co was surprised by its volume of non-billable work. This revelation brought change to workflow management and project scope control.
Toggl Track increased our profitability by at least 20%. We found out where the team was spending too much time. Whether that was us being inefficient or over-serving or working too slowly, Toggl Track gave us the ability to restrategize, find out what’s wrong, and fix it.
Dax Kimbrough, Business Consultant, Sweat+Co
3. Highlight inefficiencies and make adjustments
Time tracking data reveals why work friction and resource waste happen. You may be allocating too many resources to low-impact assignments and assigning too few to labor-intensive yet needle-moving ones.
For example, you can stack two client accounts to determine which brings higher revenue because of fewer communication delays. Or, you can benchmark performance changes after adopting a new business tool or streamlining a process in two customer service teams.
With time insights, you can improve your staffing levels, determine the ROI of new software, re-negotiate client contracts, and make other improvements to your processes to improve business efficiency and profitability.
Moreover, you can empower your talented employees to excel by coaching them to set better goals, try new management techniques, or effortlessly get into the deep work state.
4. Set revenue-centric goals for teams
To pull in good revenue, you need to continuously improve your workforce efficiency. For many leaders, that often translates to making people ‘busy’ every second of their day.
But ‘busy’ doesn’t automatically equal extra revenue or productivity. So, your people may be stuck chasing the wrong objectives or dragged down by underlying inefficiencies. To avoid that, we recommend tracking KPIs like:
- Billable vs. non-billable hours per employee, and then eliminate the dreadful admin
- Resource utilization rate — the percentage of an employee’s available time spent on billable or revenue-generating work to ensure optimal resource allocation
- Project profitability — high revenue and high expenses mean lower net profit and profit margins, which isn’t great
- Task completion rate to understand how effectively employees cycle through different tasks and address any workflow or performance issues
With Toggl Track, you can monitor all the above over any time period (week, month, quarter, year) … plus set specific revenue goals for your employees.
You might set a goal for your product manager to work on specific projects, including all their sub-tasks, for at least 10 hours this week. Or ask your designer to work on a new campaign deck for client Z for at least five billable hours.

Toggl Track Team Goals help managers direct people’s efforts to the highest priority tasks to hit the bigger revenue or velocity rate goals.
Your people, in turn, concentrate on delivering results while also having enough flexibility to plan their days. At Toggl, we use an RAFT framework (Results and Accountability First at Toggl).
RAFT prioritizes results over effort or hours. We trust our skilled human capital to figure out how, when, where, and how they make the best work happen (while coaching them on effective time management).
Some Togglers love working at the crack of dawn, while others don’t log in until midday. We don’t mind if people sign off early on some days and then clock in extra time on another as long as they hit all assigned goals and personal OKRs.
RAFT allows us to build a strong remote culture of high individual accountability, driving both high employee satisfaction and steady revenue growth per employee.
5. Invest in training and other strategic tools for ongoing improvements
Overall, there are many things you can tinker with to improve your revenue per employee metric, such as:
- Adjusting your pricing strategy
- Exploring new revenue streams
- Finding cheaper suppliers
- Improving logistics costs
- Or diversifying into a new market
The success of all of these efforts will hinge on your workforce specialization and expertise. If you’ve got a bloated organizational structure and many redundant roles, your RPE won’t budget without some restructuring. Similarly, your low revenue won’t miraculously climb if your business faces several skills mismatches.
Start a conversation with your Human Resources team. Do they have enough data for informed workforce planning? HR software like Lattice and 15Five can better track headcount growth, employee performance, and engagement metrics.
Skills assessment tools like Toggl Hire, in turn, can give you hard data on your people’s competencies, allowing you to plan training activities and screen new candidates for specific skills. Revenue platforms like Clari and Salesforce can measure revenue contribution per client-facing representative and continuously track sales team efficiency.
The bottom line: For your operating model to attain peak profitability like Apple’s and Mastercard’s, you must constantly measure, tweak, and look for new ways to excel at what you do.
Generate higher returns with Toggl Track
Toggl Track reveals exactly how your company generates revenue and where opportunities are lost to operating inefficiencies. Here’s how you can use our platform to up your RPE game:
- Use a pre-made report view to run a profit loss analysis for any given period to evaluate your business health.
- Track employee profitability at both project and individual levels by analyzing their billable hours and progress toward OKRs.
- Avoid poor resource allocation choices with predictive project duration and budget insights.
- Identify workflow inefficiencies, non-productive tasks, and bad time management habits, stalling your people from reaching peak productivity.
- Benchmark team performance to evaluate the impacts of business process optimization and adoption of automation tools.
Don’t leave RPE up to chance — start using Toggl Track to unlock your people’s full potential and reach your optimal operating state. 🚀
Book a free Toggl Track demo and explore how to drive higher business performance and profitability.

Elena is a senior content strategist and writer specializing in technology, finance, and people management. With over a decade of experience, she has helped shape the narratives of industry leaders like Xendit, UXCam, and Intellias. Her bylines appear in Tech.Co, The Next Web, and The Huffington Post, while her ghostwritten thought leadership pieces have been featured in Forbes, Smashing Magazine, and VentureBeat. As the lead writer behind HLB Global’s Annual Business Leader Survey, she translates complex data and economic trends into actionable insights for executives in 150+ countries. Armed with a Master’s in Political Science, Elena blends analytical depth with sharp storytelling to create content that matters.


