Maximizing Project Profitability: Revenue, Retainers, and Really Balanced Workflows
We all love a sexy revenue tagline. Seeing “$100M agency founder” in a LinkedIn bio is immediately impressive. But often, it’s just smoke and mirrors.
The real financial health of any business lies beneath the surface, buried in spreadsheets and nerdy analysis. The truly valuable metrics you should pay attention to aren't as neat or glamorous as total revenue, but they're the lifeblood that makes that braggadocious number possible.
This playbook is for you if:
Your profit margins keep shrinking despite increasing revenue
You're constantly putting out fires instead of building strategic, profitable client relationships
Your team is trapped in a cycle of overwork and burnout because utilization isn't properly managed
You can't confidently benchmark project pricing because you don’t know how time is actually spent
You suspect scope creep and misalignment are silently eating away at your margins
We'll share insights from Hannah McClenaghan, Operations Manager at Talk Shop Media, and serial agency founder Eli Rubel, who's done $10M in agency profit since 2020 and is currently building Profit Labs, an agency dedicated to helping other agencies get their finances in order.
Both Hannah and Eli transformed their agencies by making project profitability a team-wide mission centered around strategic time tracking. Combining their insights with our advice, we’ll help you implement systems that streamline decision-making around profitability and lead to better financial gains across your entire organization.
How to price
retainers for
steady revenue
One of the most reliable ways an agency can become (and stay) profitable is through well-structured retainers.
For agencies juggling multiple clients, fluctuating workloads, and tight margins, retainers offer a path to predictable, scalable revenue you can actually plan around. They also build longer, more strategic client relationships, which translates to better outcomes and stronger margins over time.
Let’s break down the main agency billing models for retainers.
Flat Fee Retainers
You charge a fixed monthly fee for a defined set of deliverables. This is ideal when you have time-tracking data to accurately estimate effort.
Long-term clients with consistent, predictable needs
- Predictable revenue and simpler forecasting
- No hourly billing admin (though internal tracking is still key!)
- Can create templates for future projects that are similar
- Risky if time estimates are off
- Scope creep can erode margins
$5K/month for social media across three platforms, project costs $2.5K in time = 50% margin.
Time-based Retainers
You allocate a set number of monthly hours at an agreed-upon rate, and clients can use time flexibly across services.
Clients with fluctuating needs
- Flexible for both sides
- Easy to adjust month-to-month
- Based on a stable hourly rate
- Needs diligent time tracking
- Project revenue can fluctuate if hours go unused
30 hours at $150/hour = $4,500/month, used across design services.
Tiered Retainers
You offer service packages (e.g. Bronze, Silver, Gold) at ascending price points and service levels.
Growing, high-value clients
- Encourages upselling
- Matches client growth
- More complex to manage
- Requires clear tier differentiation
A PR agency offers tiers from $3K to $10K/month, each with different services and margins of around 40%.
3 common pricing pitfalls to avoid
Forgetting to bill for your admin work: Emails, meetings, and project management are billable — track them!
Using set-and-forget retainers: Revisit retainer pricing quarterly to keep margins healthy.
Undercharging for strategic work: High-level thinking is worth more than execution — charge for it!
“I can say with confidence that our offering from $20,000/month to $45,000/month changed very little.They weren't getting double the service. But we were getting really good at what we do, and we were charging more for it. ”Watch the full interview with Eli here
Understanding the silent killers of agency profitability
When agencies struggle with profitability, they often focus on obvious factors like pricing or market conditions. But it’s rarely that simple — the real profit-drainers quietly erode margins from beneath the surface. Here are three of the most common culprits:
❌ Misalignment
The most insidious profit-killer. When departments operate in silos or when client goals aren't properly communicated across teams, it results in wasted effort and resources. Creative teams develop concepts that don't align with strategic objectives, developers build features clients never requested, and account managers scramble to bridge communication gaps. This disconnect directly translates to lost revenue — not because you didn't do the work, but because it wasn't the right work.
💡 Solution
Implement cross-functional project kickoffs where all stakeholders align on deliverables and success metrics. Create shared documentation accessible to all team members that clearly outlines project scope, timeline, and client expectations. Optionally, throw in a 15-minute weekly all-hands to align on team priorities.
❌ Scope creep
Scope creep hits agencies particularly hard, especially those without established pricing strategies or clear scoping processes. What begins as "just a small addition" eventually amounts to thousands in unbilled time. As one project's timeline extends, it directly impacts the capacity for new business, creating a dangerous profit margin domino effect.
💡 Solution
Develop a formal change request process that documents additional work and requires client approval before proceeding. Price these changes appropriately and communicate the impact on the timeline and deliverables. Enshrine it in your contracts, and be forthcoming about them on client discovery and onboarding calls to avoid nasty surprises later on.
❌ Process inefficiencies
Process inefficiencies might seem minor in isolation — an unnecessary meeting here, a duplicated task there — but they compound rapidly. As the gap between billable hours and actual costs balloons out of proportion, you’ve just died a death by a thousand wasted hours.
💡 Solution
Conduct regular workflow audits using time tracking data to identify bottlenecks and redundancies. Implement streamlined approval processes and eliminate low-value administrative tasks.
In fact, Eli sees time tracking as a non-negotiable in his agency.
Fix these 6
profitability killers
with smarter
time tracking
Eli's razor-sharp approach to time tracking has allowed him to make drastically better business decisions. Armed with accurate time data, he can automatically extract metrics like direct costs, gross profit margin, and utilization rate. He can also see how the team's workload is spread, which is key to preventing burnout and maintaining a healthy work-life balance.
Time tracking is a strategic solution that lights the way to clearer staffing and strategic decisions, even in the face of these common challenges.
1. Inaccurate billing is eating into your agency margins
You can't bill for something you haven't tracked. If you rely on your contractors' calendar archives or manual timesheets to bill your clients, you're leaving money on the table. Unbilled hours silently accumulate, directly impacting bottom-line results.
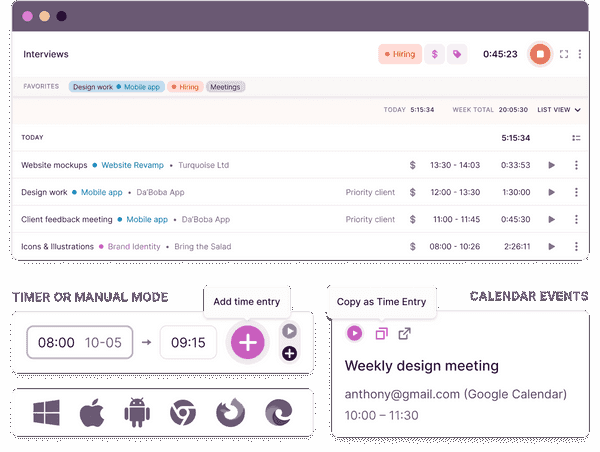
A time tracking tool like Toggl Track enables real-time tracking across all devices, ensuring every billable minute is captured. The platform differentiates between billable and non-billable hours, providing visibility into true project profitability. With automated tracking options, your team can focus on client work while the system captures their effort in the background.

2. You’re tracking revenue instead of net profit margin
Many agency leaders focus exclusively on top-line revenue. It’s easier to measure and sexier to share.
Toggl Track connects hours spent to revenue generated, allowing you to calculate true profit margins by project, client, and service line.

There’s no one-size-fits-all answer to the ideal profit margin. Eli tries to keep his between 45-55% — but no matter your margins, you’ll likely want more, since 92% of agency owners of all sizes believe there's scope to improve their margins.
3. You’re struggling to manage effective resource allocation across projects
Think of your agency like a busy restaurant kitchen — if you don't know which dishes are raking in profit and which are just burning time and butter, how do you know what to keep on the menu?
That’s where the Profitability Index (PI) comes in. PI is one type of project profitability analysis that shows how much value a project generates per unit of initial investment — a must-have metric when resources are tight. It helps you spot which clients or project types deliver the best bang for your buck.
Time tracking turns PI into a practical tool:
- It shows exactly what time (and cost) each project consumes
- It reveals which types of work consistently yield higher returns
- It helps fine-tune team structures to boost efficiency and profit
With strong time data, you’re making smart, informed calls about where to invest your team’s time.
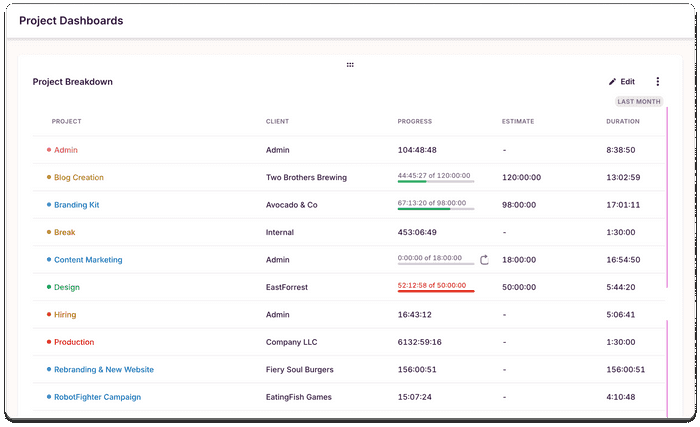
With Toggl Track's Project Dashboard, this data becomes readily accessible, enabling proactive resource management rather than reactive crisis responses.

4. You’re guessing if future payments will cover today’s work
When income projections don’t align with a project’s total costs, you risk overcommitting and under-delivering. Unclear forecasting makes it harder to confidently say yes to new projects because you're unsure if you have the resources to follow through.
Here’s how to fix it:
1. Forecast like a pro.
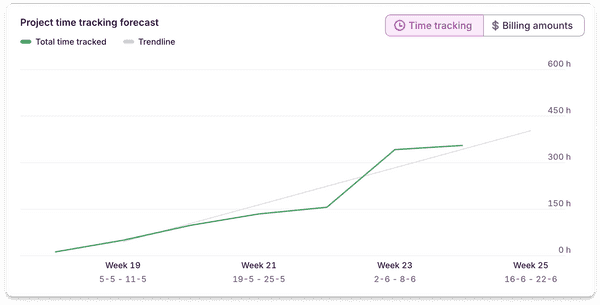
Use real-time project data to anticipate costs, prevent scope creep, and stay on budget. Toggl Track’s Project Dashboard shows forecasted time and billing progress — so you always know how close you are to completion.

🕒 Time forecasts show progress based on tracked hours vs. estimates

💰 Billing forecasts track how billable hours stack up against fixed fees
2. Get cozy with your Net Present Value (NPV).
NPV highlights the present value of future cash flows. It answers the question, “Will this project bring in enough money later to justify the time we put into it now?” It's based on the idea that $100 today is worth more than $100 a year from now.
The better your time tracking, the more accurate your NPV. You’ll know:
- How long similar work has taken before
- If current projects are trending over budget
- When you hit milestones and get paid
Toggl Track gives you a birds-eye view of your projects so you can make smarter, faster financial decisions.

5. Evaluating potential project risks is challenging
Running an agency is a tight balancing act between what is promised and what is delivered, with a profit margin in the middle. Two big unknowns wreak the most havoc on profits: scope creep and stretched timelines.
1. Scope changes are like throwing a wrench in a finely tuned engine.
When scope grows, but team capacity stays the same, suddenly, people are spread thin or working overtime — often unbilled. That means utilization may look high on paper, but it's not efficient or profitable. On the flip side, if teams are stuck waiting on client input due to unclear scope, their time isn't used productively, dragging utilization (and agency margins) down.
2. Stretched timelines drain profits and freeze your pipeline.
If a project overruns by two months, your team is tied up rather than devouring new business.
We had projects dragging on, which killed our margins. Now, our contracts say that if a project goes over its timeline plus a 15-day grace period, the client pays a retainer fee — because they’re taking up our time. — Eli Rubel
6. You’re unsure ongoing project performance will meet financial expectations
Time to get technical again: this is where your Internal Rate of Return is your best friend.
A project’s IRR is like a report card for its financial performance. It shows the percentage of return you're getting from the money and time you've already invested in the project. If you’re tight on resources, you can compare project IRRs against each other to decide which to terminate and which to follow through on.
If this is all too much math and you’d rather start with a sleek profitability dashboard, we hear you. Toggl Track’s flexible reporting tools let you build custom dashboards using visual elements like bar charts, pie charts, and tables — giving you a clear, real-time view of how projects are tracking against expectations. Analyze performance by member, client, project, or task to make smarter calls on pricing, staffing, and scope before things go off track.

Case Study: Talk Shop Media redirected 60–80 hours per month to billable client work
For over a decade, communications agency Talk Shop Media had relied on end-of-week manual time logging, which was unsurprisingly messy, inconsistent, and chaotic. Hours were missed, 1,500+ line items clogged up weekly timesheets, and ops managers spent too much time chasing down incomplete entries. It was a compliance nightmare.
Operations Manager Hannah McClenaghan decided enough was enough. Her job was to optimize systems and processes to maximize efficiency and profitability — but she didn’t have any reliable baseline data to do so.
She knew the fix had to effortlessly slot into her team's life without adding to their workload. The solution? Toggl helped them build a system that fit their workflows, not the other way around. After making the switch to Toggl Track, the results speak for themselves.
👉 90% adoption across all levels
👉 50% less time spent tracking time
👉 Up to 80 extra hours per month reclaimed for client work

Read the full Talk Shop Media case study
Use time data to
balance workflows and protect your team
Time tracking is all about uncovering insights that drive smarter decisions. Use these four monthly time reports to keep profitability front-of-mind for everyone in your organization — not just finance and accounting.

Account efficiency report
Use time data to compare estimated hours against how long the work actually takes. If the hours you sell the client on their retainer vary greatly from hours worked, it’s time to revisit the contract or scope.

Billable vs. non-billable hours report
Reviewing the split between billable and non-billable hours helps you stay on track and hit KPIs. For example, Talk Shop Media’s juniors aim for an 80:20 split. Accurate time data keeps everyone aligned.

Project dashboards
Give team leads a bird's eye view of where hours are going. If 70% of retainer hours are spent halfway through the quarter, this data refocuses efforts to the highest-impact work with the hours that remain.

Team health tracker
This one’s for your people. Keeping an eye on workloads helps spot overwork early. By flagging team members logging excessive hours, you can act quickly to avoid burnout, maintain productivity, and safeguard well-being.
A framework for keeping your people happy
Burnout costs US employers $4,000 to $21,000 per employee per year. With 82% of employees at risk of burnout in 2024, balancing workloads fairly has never been more important.
The Capacity Profitability Framework offers a structured approach to combat this rising issue by integrating time tracking data with project profitability metrics. This enables leaders to identify when team members have too much (or too little) on their plates.

Step 1: Define each team member’s maximum capacity
While a 40-hour workweek exists on paper, sustainable billable hours typically range from 75–90% of total time (30–36 hours weekly). This accounts for necessary administrative work, professional development, and preventing burnout.

Step 2: Measure utilization accurately
Implement time tracking to monitor actual billable hours against capacity targets. This provides visibility into:
- Who's approaching burnout (consistently above 90% utilization)
- Where capacity is being underutilized (consistently below 75%)
- Which projects and clients consume disproportionate non-billable time

Step 3: Calculate profitability per utilized hour
Not all billable hours generate equal agency profit. Analyze which services, clients, and team configurations deliver the highest return on time invested.

Step 4: Make data-driven adjustments
Use this combined capacity–profitability data to:
- Adjust team allocations to balance workloads
- Identify training needs where efficiency lags
- Re-price services where project profitability falls below targets
- Make tough decisions about client relationships that are straining capacity and profitability
The framework keeps your team operating in a productivity sweet spot. Proper time tracking eliminates guesswork and refines the process until it becomes second nature.
Your “quick wins” checklist
Here’s a quick-fire round of action steps you can take to improve your agency's profitability today:
✅ Implement cross-functional project kickoffs to align all teams on deliverables
✅ Create a formal change request process to combat scope creep
✅ Start tracking billable vs. non-billable hours immediately with Toggl Track
✅ Analyze completed projects to identify your most profitable service types
✅ Set up monthly account efficiency reports comparing estimated vs. actual hours per project
✅ Schedule quarterly retainer reviews to adjust pricing as needed
✅ Establish utilization targets (75–90%) for all team members
✅ Keep an eye on your team’s well-being through Toggl track’s dashboard

Ready to turn time data into margin gains? See how Toggl Track can give you laser-focused profitability insights across your entire agency. Book a demo to speak to sales and learn how to implement these strategies straight into your workflows.


