

Gantt chart software that shows who's over capacity before the week starts
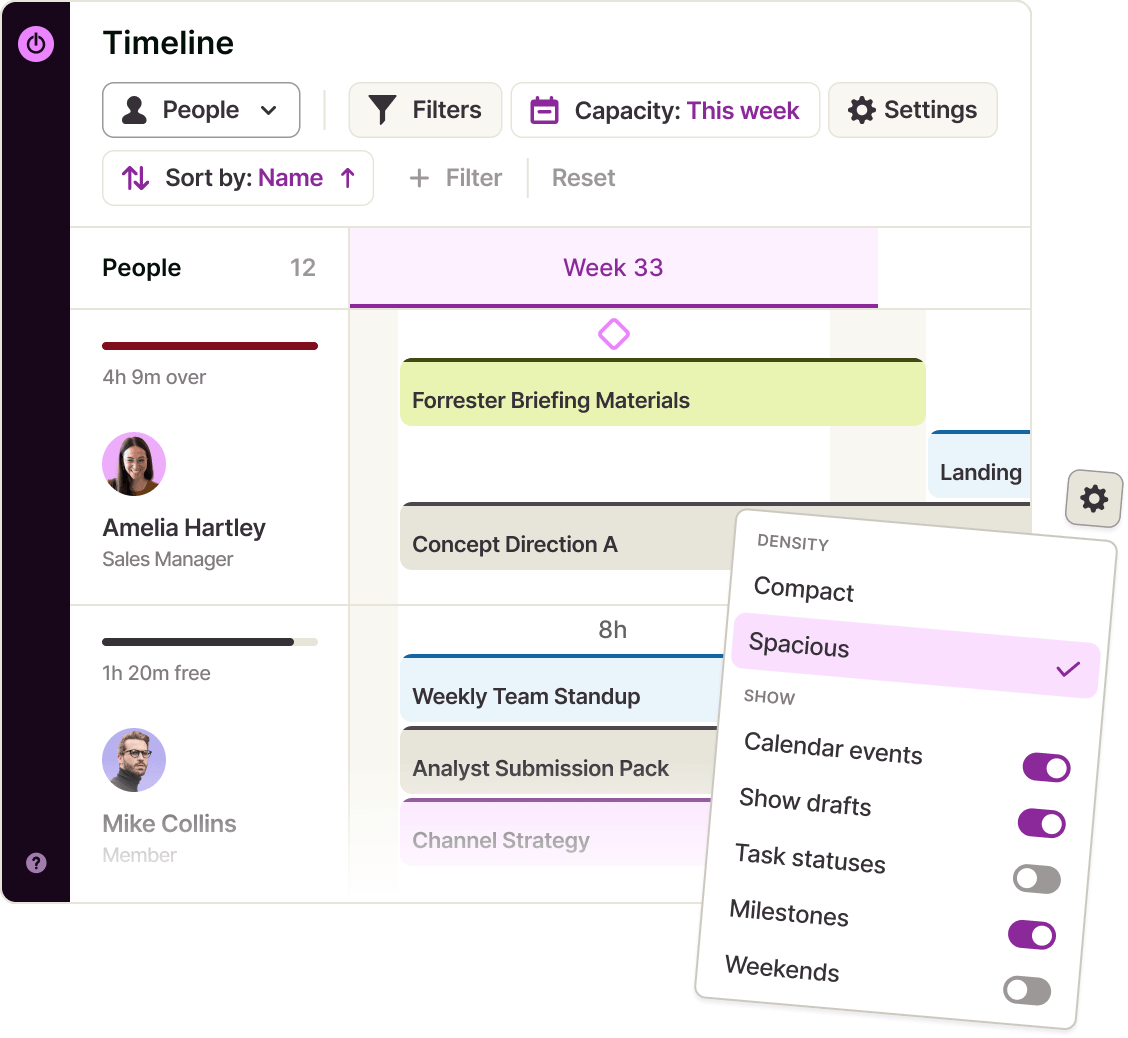
Toggl's Gantt chart view turns projects into a drag-and-drop timeline: schedule work across people, projects and tags, mark the deadlines, and see who's over capacity before the week or the project starts.

Drag to schedule, drag the edges to reschedule
Group the same timeline by People, Projects or Tags
Live capacity per person, with time off and public holidays already accounted for








Project scheduling built on tracked hours
Most Gantt tools stop at the plan. Toggl's timeline sits on top of the same tasks your team tracks time against, so the schedule and the actual hours never drift into separate tools.

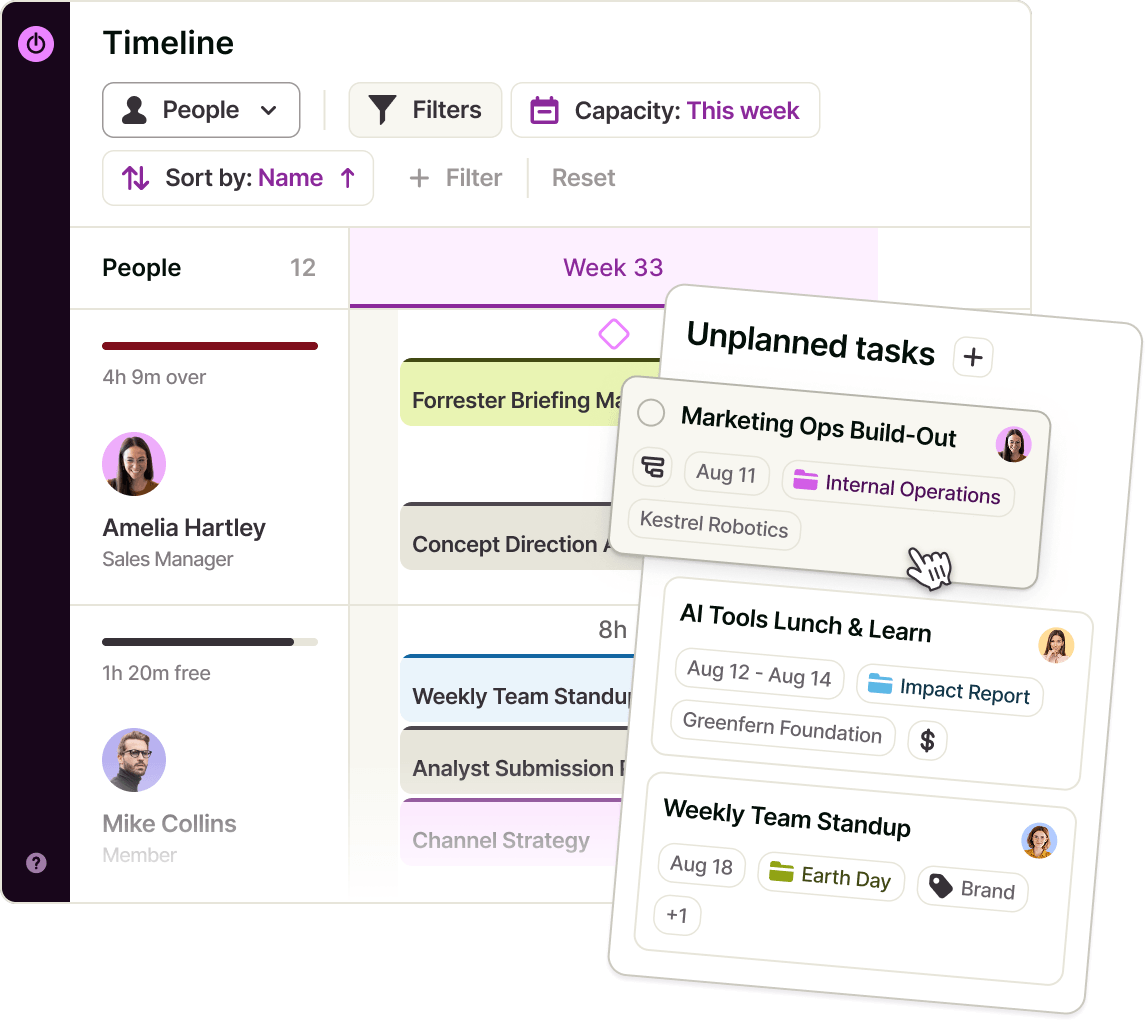
Schedule by dragging
Click and drag on an empty row to create a task. Move the bar to reschedule it, adjust either edge to change the dates, or drop it onto another person’s row to reassign it.

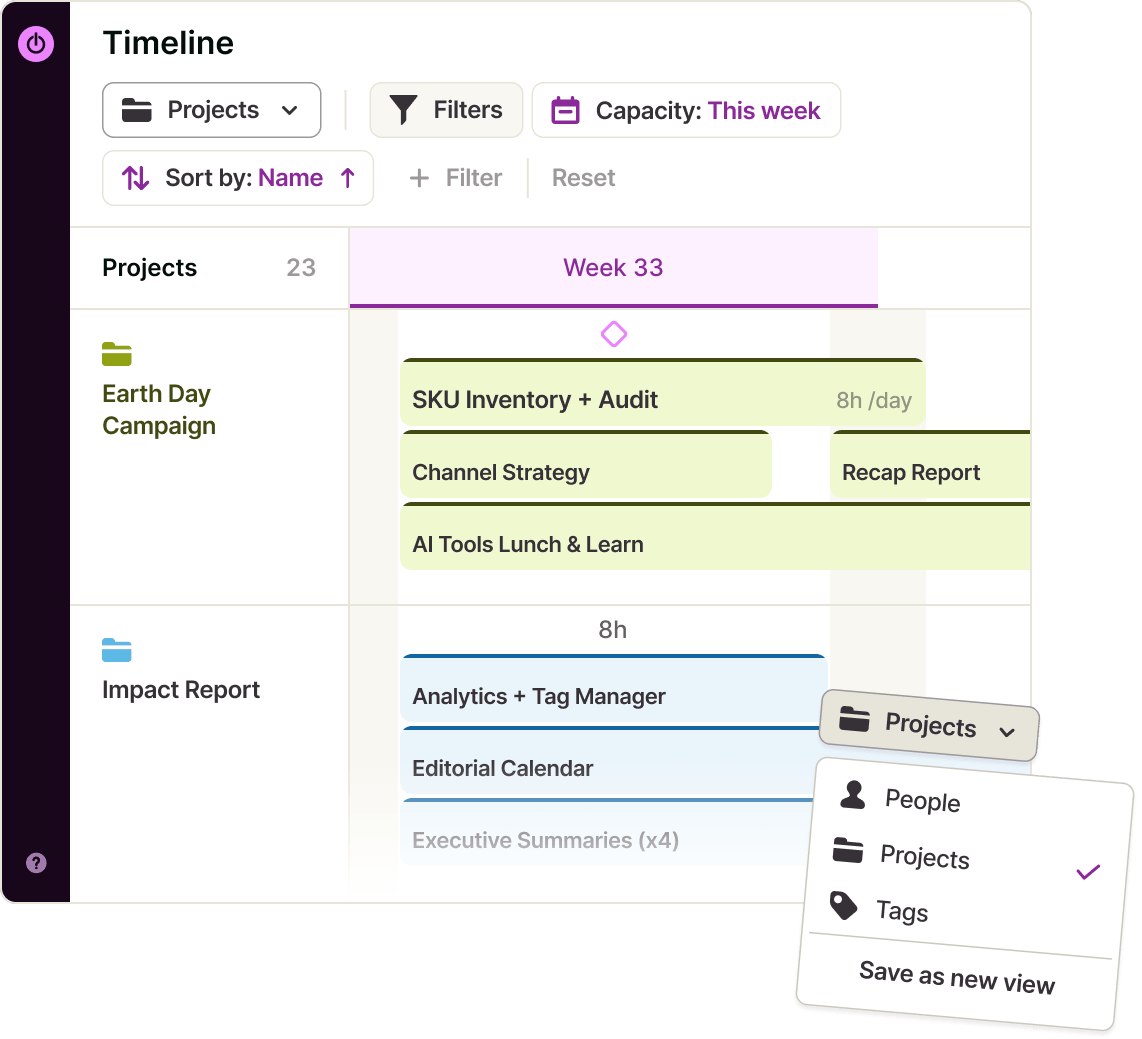
The same plan, three ways
Group the timeline by People to see who is doing what, by Projects to see how the portfolio lines up, or by Tags to follow a workstream that cuts across both. Filters carry across when you switch, and you can save the whole arrangement as a view your team opens on Monday morning.

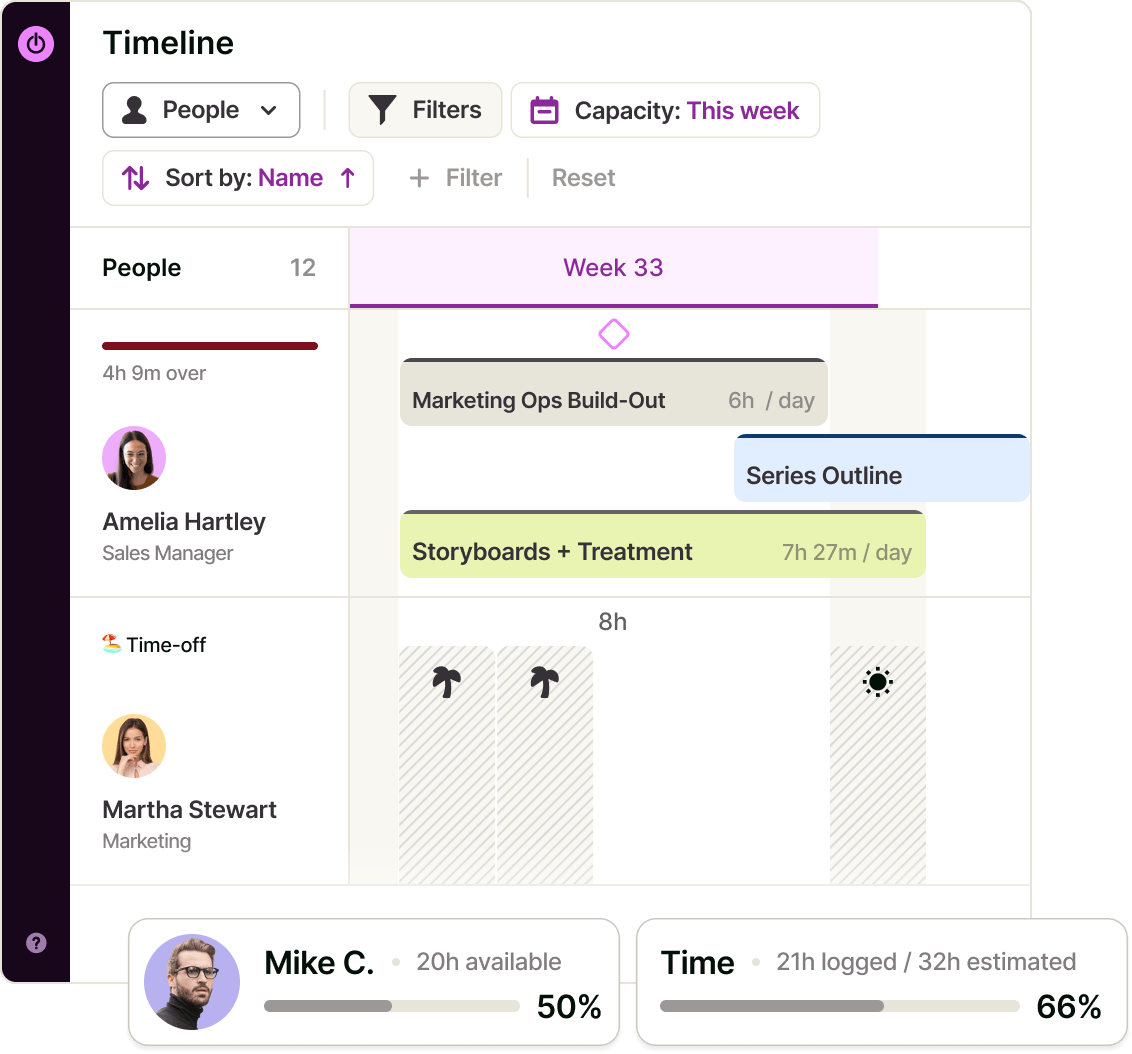
Capacity on the row (not in a separate report)
Grouped by People, each row shows a capacity meter: the percentage of that person’s working hours that’s still available or already overbooked, based on the period shown. Non-working days, public holidays and approved time off appear directly on the timeline, so you’re planning around real availability.

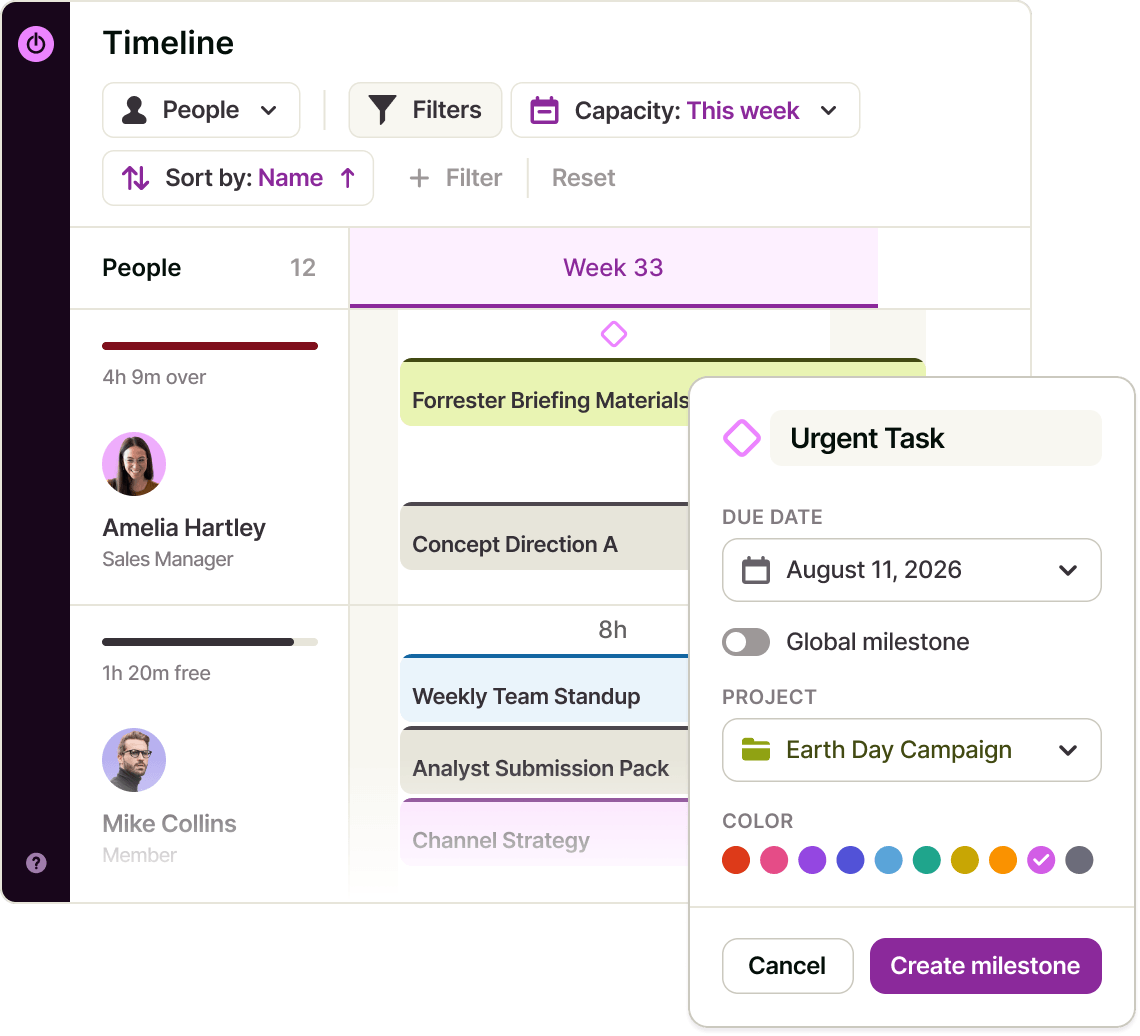
Milestones everyone can see
Pin a colour-coded milestone to a date and it drops a marker across the timeline. Scope it to specific projects or teams, or make it global so it shows on everyone's view.

Deadlines and meetings
Connected Google and Outlook calendar events are automatically factored into the Timeline and capacity calculations, so the week you’re scheduling reflects the time people actually have available.



Gantt chart software features
How does Toggl’s Gantt charts work?
1. Create your projects and tasks.
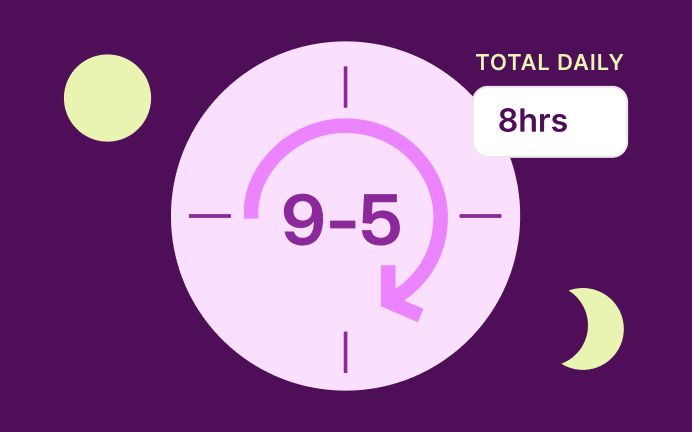
Tell Toggl when your day starts and ends so the calendar plans against real availability.
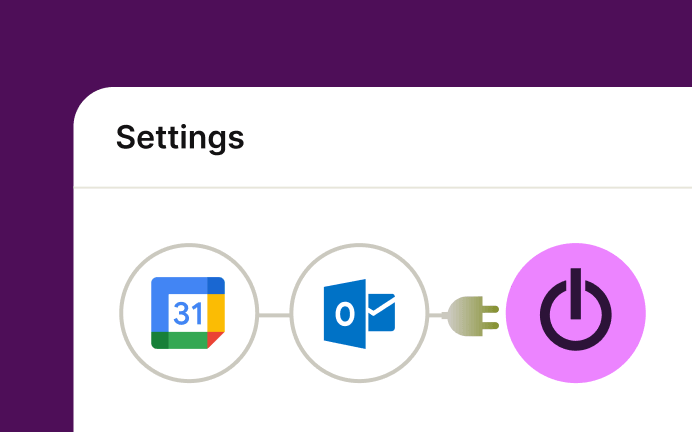
2. Connect calendars, auto-track meetings
Your calendar meetings appear on the grid alongside your planned work, and you choose which calendars to show. Add matching rules so recurring events map to the right task and project without you touching them.
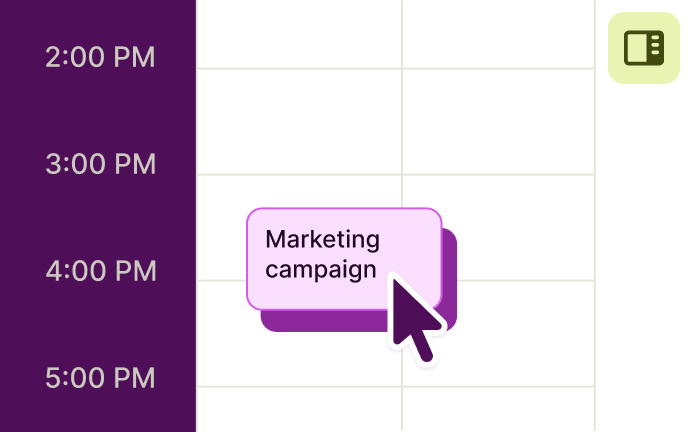
3. Drag tasks onto the day
Pull work from the backlog panel onto the calendar and size each block to the time you expect it to take.
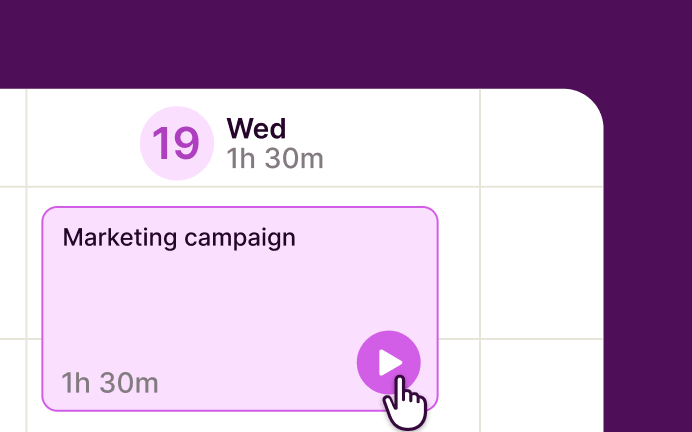
4. Start the timer
Hit play on the block you're working on; the entry renders live on the calendar as it runs.
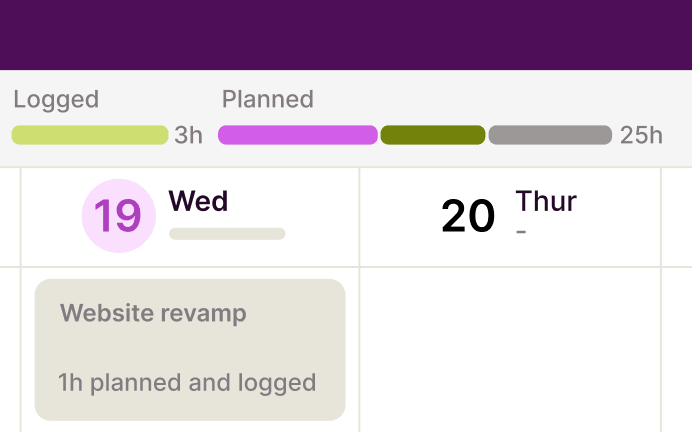
5. Compare plan to actual
Each block shows planned vs. logged time, so you can see where the day drifted and plan the next one better.
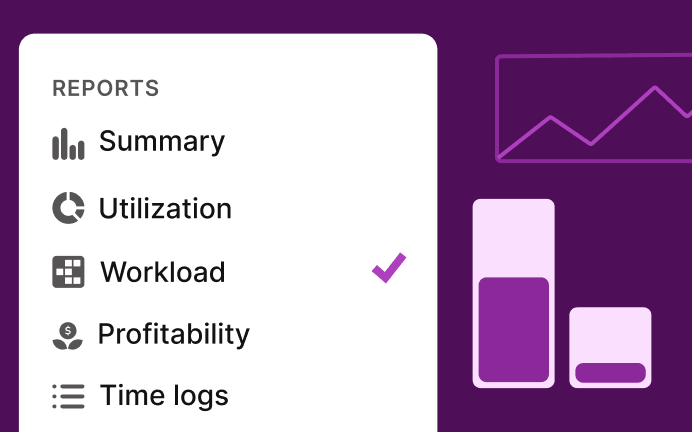
6. Report on it
The same blocks and entries roll up into summary, billable, and (on Premium) workload and utilization reports.
FAQs